In a previous blog (December 3, 2012) I described a common exercise that I give to students to highlight the important skill of scenario building:
In the table below I ask undergraduates from my course (General Education – no prerequisites) to use primary sources to collect some relevant data about four countries and the World, and to answer a few questions by evaluating this data. I have filled in part of the table with the appropriate data for 2008 – the last year that data were available for the indicators in which I was interested.
Fill up the following table:
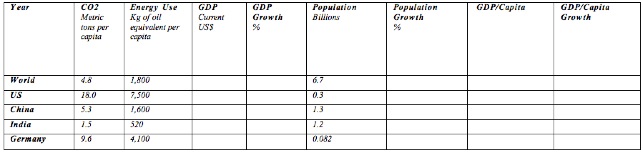
Rank the four countries in terms of total energy use and CO2 emissions.
- Compare (in %) the top user and emitter with World use and emission.
- Rank the four countries in terms of energy use and CO2 emission per capita, and compare the numbers with global data.
- If the GDP growth continues – how many years will it take China to catch up to the US?
- If the GDP/Capita growth continues – how many years it will take China to catch up to the US?
- What will the World’s GDP be at that time?
- What will the World’s population be at that time?
- If you assume that the last three terms of the IPAT equation will not change – what will the World’s CO2 emission be at that time?
- Assume that only half of the emissions will stay in the atmosphere and that the Climate Sensitivity is 2.50C for doubling the concentration of CO2 compared to the pre-industrial levels – what will the climate consequences of 8 be?
In my February 17, 2015 blog I essentially repeated this exercise, focusing on India. Since I was already planning a vacation this summer, I used some of my time to try the exercise in real life with a focus on China. I left for China with my wife on June 28th and we just came back. I will try to describe some of our experiences within the next few blogs.
The figure below maps the places that we visited:
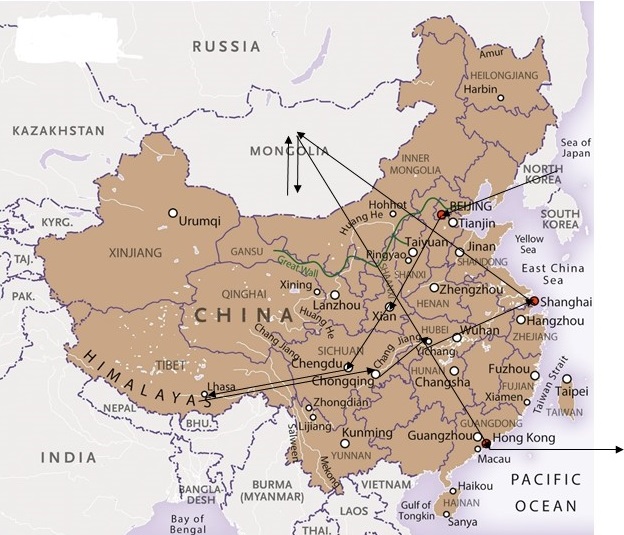
The last time I visited China was in August of 1992. I was on the organizing committee of a solar energy conference that took place in Beijing and I followed up the conference with visits to Xian and Shanghai. This 23 year gap is approximately equal to the span of a new generation. Here are some of the changes that took place in China over this period, as compared to their parallels in the US at the same time. The data is from the World Bank database.
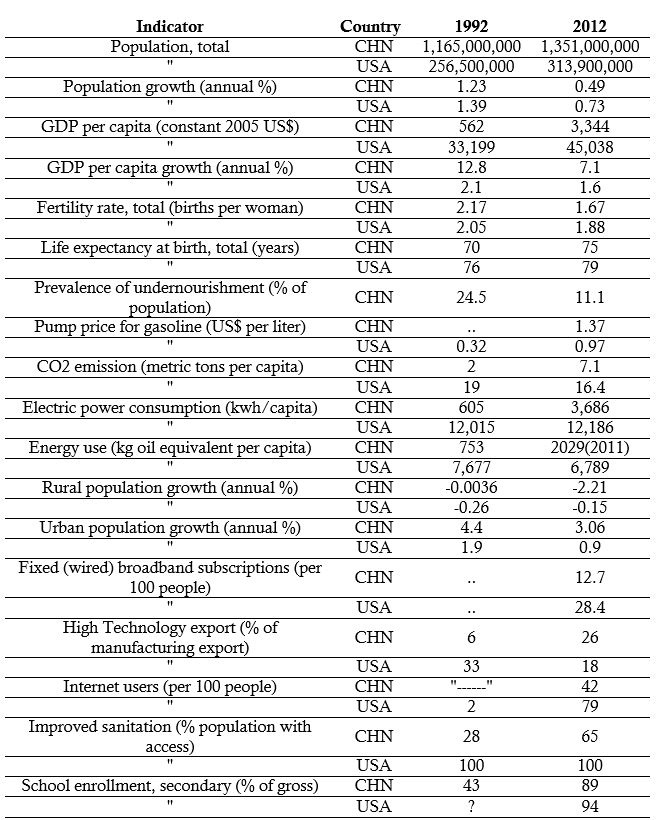
*The World Bank doesn’t supply data for “prevalence of undernourishment” for any developed country. The assumption is that there is none.
According to the World Bank and the GDP/Capita data it gives in the table, China has “graduated” over this period from being a Low Income Country to Lower Middle Income Country. However, looking at other indicators and paying attention to factors such as school enrollment, improved sanitation, internet users high technology export, fixed broadband subscriptions, life expectancy and fertility rates suggests a much sharper transition. Of course, indicators tracked in statistical comparisons are markedly different from the anecdotal impressions that accompany an actual visit.
China’s population now constitutes close to 20% of the world’s population. The urban population in China now (2012) makes up around 52% of the total (World Bank), as compared with the US, whose urban population comes to 81%. In 1992 the urban population in China was 28%; that in the US was 72%, so the growth in China’s urban population by 2012 was more than three times faster than that in the US in the same time. In short, a visit to some of China’s megacities is important. Of course, what stands out most to a visitor is far different than what is reflected in the table. You notice the heights of the buildings, the number of passenger cars in the cities, the quality of the roads, the extent of public transportation, the infrastructure of the power delivery, the quality of the air, and the availability of goods – from essentials to global luxuries. Probably the most important test of progress in economic development is: what happens if you have a highly developed area in close contact with an underdeveloped one? What steps must be taken to prevent people from moving illegally across the border in order to improve their economic wellbeing? Such an experiment actually exists in the form of Hong Kong and Shenzhen.
In the next few weeks I will try to focus my blogs on the various aspects of China’s efforts toward further development and the implications that these efforts hold for a global transition to more sustainable energy sources.