While I was in China (see last week’s blog), one of the questions that I asked most often – especially of those who mentioned that they have small children – was how people imagine China 20 years from now. This question stemmed, in large part, from the immense changes that I saw since my first visit in 1992. Invariably, people answered they expect economic progress to continue at roughly the same pace as it has over the last 20 years. This prognosis is worth examining further because it has strong implications about the future of the world and it is thus relevant to all of us.
Last week I looked at China’s progress from 1992 to 2012 using data from The World Bank database (more recent data were not available). The World Bank also has country reports. Here is a paragraph from its recent entry about China:
Since initiating market reforms in 1978, China has shifted from a centrally planned to a market based economy and experienced rapid economic and social development. GDP growth averaging about 10 percent a year has lifted more than 500 million people out of poverty. All Millennium Development Goals have been reached or are within reach.
With a population of 1.3 billion, China recently became the second largest economy and is increasingly playing an important and influential role in the global economy.
Yet China remains a developing country (its per capita income is still a fraction of that in advanced countries) and its market reforms are incomplete. Official data shows that about 98.99 million people still lived below the national poverty line of RMB 2,300 per year at the end of 2012. With the second largest number of poor in the world after India, poverty reduction remains a fundamental challenge.
Rapid economic ascendance has brought on many challenges as well, including high inequality; rapid urbanization; challenges to environmental sustainability; and external imbalances. China also faces demographic pressures related to an aging population and the internal migration of labor.
It is worth mentioning here that RMB 2,300 is approximately equivalent (in today’s exchange) to $1US/day. China has two especially large challenges to rapid economic growth: the increase in income inequality and the environmental impact, but I will save the latter for another time.
Before starting on increased income inequality, I have to put my writing into perspective. I am obviously a very biased observer: an American tourist with enough resources to see the world from the balcony of five star hotels for the duration of my month-long visit, almost all of which was focused within Chinese megacities (cities with populations that exceed ten million people). This is not the view that one acquires from the residences of inhabitants who live off of $1US/day. To get some semblance of reality and balance, I will rely strongly on literature published by somewhat more objective observers.
Over the years, I have spoken frequently in this blog about the role of income inequality in the global response to climate change (see January 7, August 19, and September 9, 2014). There are various ways of measuring inequality; one of the most common is the use of the Gini coefficient:
The Gini coefficient (also known as the Gini index or Gini ratio) (/dʒini/ jee-nee) is a measure of statistical dispersion intended to represent the income distribution of a nation’s residents, and is the most commonly used measure of inequality. It was developed by the Italian statistician and sociologist Corrado Gini and published in his 1912 paper “Variability and Mutability” (Italian: Variabilità e mutabilità).[1][2]
The Gini coefficient measures the inequality among values of a frequency distribution (for example, levels of income). A Gini coefficient of zero expresses perfect equality, where all values are the same (for example, where everyone has the same income). A Gini coefficient of one (or 100%) expresses maximal inequality among values (for example, where only one person has all the income or consumption, and all others have none).[3][4] However, a value greater than one may occur if some persons represent negative contribution to the total (for example, having negative income or wealth). For larger groups, values close to or above 1 are very unlikely in practice.
Yu Xie and Xiang Zhou recently published a paper called, “Income Inequality in Today’s China,” in the Proceedings of the National Academy of Science (PNAS). PNAS is one of the most prestigious and selective scientific publications in the United States. It accepts papers for publication only through recommendations of members of the US National Academy and requires scrupulous reviewing before publication. Here is a segment from the paper’s introduction:
In this paper, we wish to address two research questions. How high is income inequality in today’s China and why is it so high? The first question appears to be simple fact that could be answered by government statistics. Unfortunately, this is not true for China. For a variety of complicated reasons, ranging from politics to practical difficulties, government statistics on Chinese well-being have been questioned for their accuracy. This concern is exacerbated by the long-standing concealment practices of China’s National Bureau of Statistics (NBS), responsible for constructing and releasing government data on China, such that no original microlevel data are accessible to any independent researcher that could be used to corroborate the macro level statistics it releases. In the case of income inequality, the NBS stopped releasing the Gini coefficient after it reached 0.41 in 2000. It was not until an economist claimed that the Gini coefficient had reached the shockingly high level of 0.61 that the NBS, in early 0.61, released the Gini coefficients for recent years, which were slightly under 0.5.
The paper itself cites multiple supporting references, emphasizing the need to use multiple data sources to get the necessary information and not to rely on an “obvious” source – in this case, China’s National Bureau of Statistics (NBS) – as the sole source. Please note that the World Bank data that I quoted last week originated in China’s governmental sources, so the skepticism that the PNAS paper expresses should fully extend to last week’s post.
We found the challenges China faces in its efforts to release only selected information to public consumption directly visible in our experiences during our short visit. Connectivity to applications such as Google, Facebook, ESPN, Bloomberg and The New York Times were all but nonexistent throughout mainland China, but one could circumvent most of the search restrictions by searching with Yahoo, Bing and Baidu and the news restrictions by going through the Huffington Post and other outlets. Once we crossed into Mongolia or Hong-Kong, suddenly all the applications were available as clearly as at home. The logic of all of this will probably never make sense to me, but I strongly suspect that with time, the government will become a bit more familiar with modern communication capabilities and many of these attempts of at needless and futile censorship will disappear.
The two most important findings in the PNAS paper are shown in the two figures below:
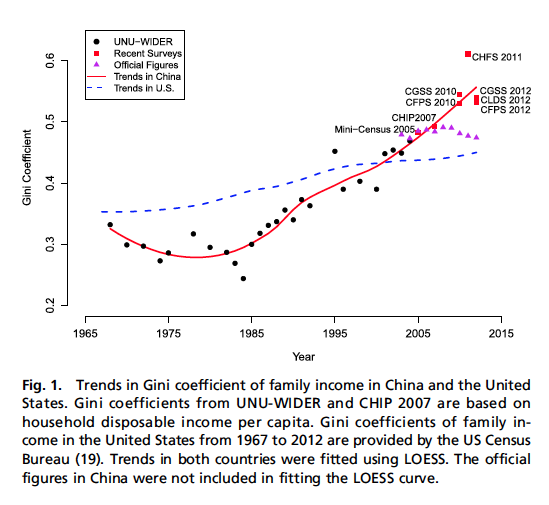
 Among the conclusions we can draw from the two figures are:
- The sharp increase in inequality (rising Gini coefficient) started shortly after China’s 1978 shift to a market based economy.
- Around 2000, China’s Gini coefficient surpassed that of the United States, even as the GDP/Capita stayed well below that of most developed countries (see last week’s blog for more data, but keep in mind the disclaimer about the World Bank’s sources).
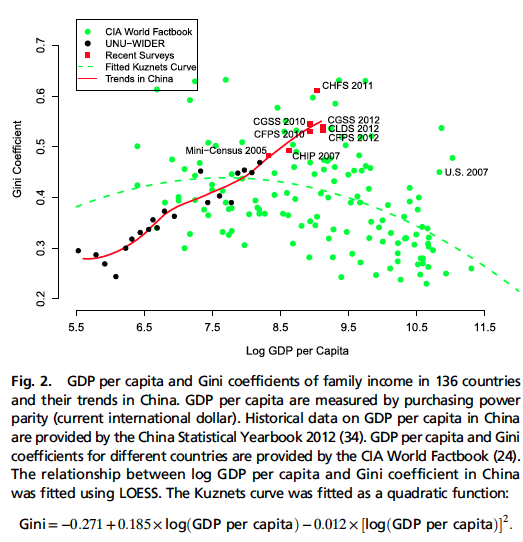
The second graph tries to demonstrate that the increase in GDP is not solely to blame for the rising Gini coefficient. It plots the Gini coefficients of 136 countries against their GDPs/Capita (in logarithmic scale – see August 6, 2012 blog). The data roughly fit (with a great deal of noise) the Kuznets curve, a hypothesis that states that after a certain threshold the Gini coefficient should start to return to a more equal distribution. It is obvious that China doesn’t follow the curve.
The PNAS authors offer data to show that the two biggest social determinants that factor into this high inequality are regional disparities and rural-urban gap. I will return to some of these issues in future blogs.
There are some games and websites that have actually been kept obstructed by the school or workplace managers, this is done so that the students or employees working in the office would not get distracted from their actual work. Unblocked Games are the games that can be played anywhere within college, workplace, and so on https://un-blocked.games/