Last week’s blog tried to summarize President Trump’s actions at the start of his second term to formalize his denial of climate change. It ended with the observation that his denial stands in contrast to the major progress that was made in 2025, globally and in the US, in the energy transition away from fossil fuels. The year marked great successes in mitigating the prospects of human-triggered (anthropogenic), destructive climate change.
The main argument the Trump administration raises is that any action away from fossil fuels and towards sustainable fuels will damage the economy, thus hurting the people who voted for him in the presidential election. Meanwhile, there has been plenty of progress in the global energy transition. These dynamics can be summarized as Trump trying to swim against the current of progress. Last week’s blog described the present US administration’s “swimming” in a manner similar to most press coverage throughout 2025. This blog will start discussing the “current” instead; this, too, is a more recent media trend:
‘A colossal own goal’: Trump’s exit from global climate treaties will have little effect outside US
How To Lose The War On Renewable Energy, Bigly
The correlation between economic growth and carbon dioxide emissions was summarized in the IPAT (Impact, Population, Access, and Technology) equation that was discussed in multiple previous blogs. Just put IPAT into the search box to find all the references for the term. A full discussion of the many aspects of the term can be read in my blog titled “IPAT: Math, Equation, Identity, and Opinion?” (September 24, 2024). The application of the term to the correlation between carbon dioxide emissions and the GDP is shown in equation 1.
- CO2= Population x (GDP/Capita) x (energy/GDP) x (Fossil/Energy) x (CO2/Fossil)
This blog focuses on 6 figures that show the clear separation of carbon dioxide emissions in developed countries (Figure 1) and 5 other graphs focused on the progress recently made in the energy transition. Carbon dioxide emissions per capita by the three largest emitters are shown in Figure 2, the global temperature rise is shown in Figure 3, and Figure 4 shows the global rise in clean energy, electrification, and efficiency. Growth in applications needed for effective use of sustainable energy are shown in Figure 5, and the projected global trends in fossil fuel use, carbon dioxide emissions, and carbon capture and storage are shown in Figure 6.
The first three graphs are posted from Our World in Data, with the primary sources cited in the graphs.
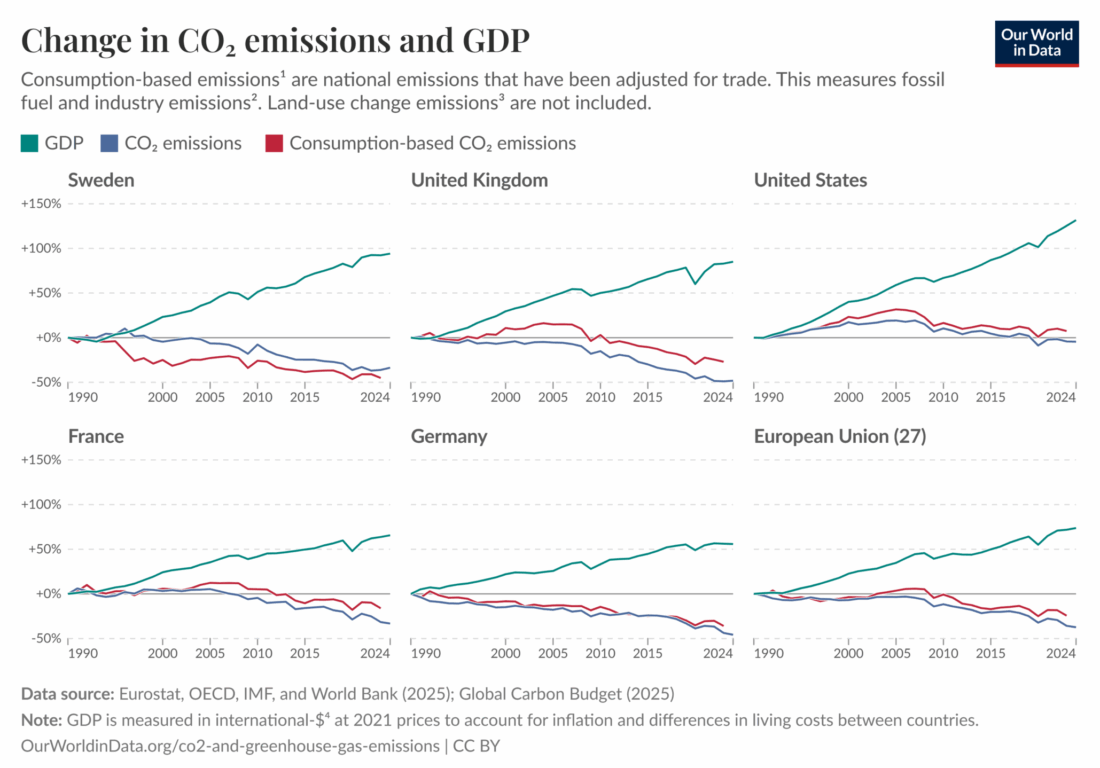 Figure 1
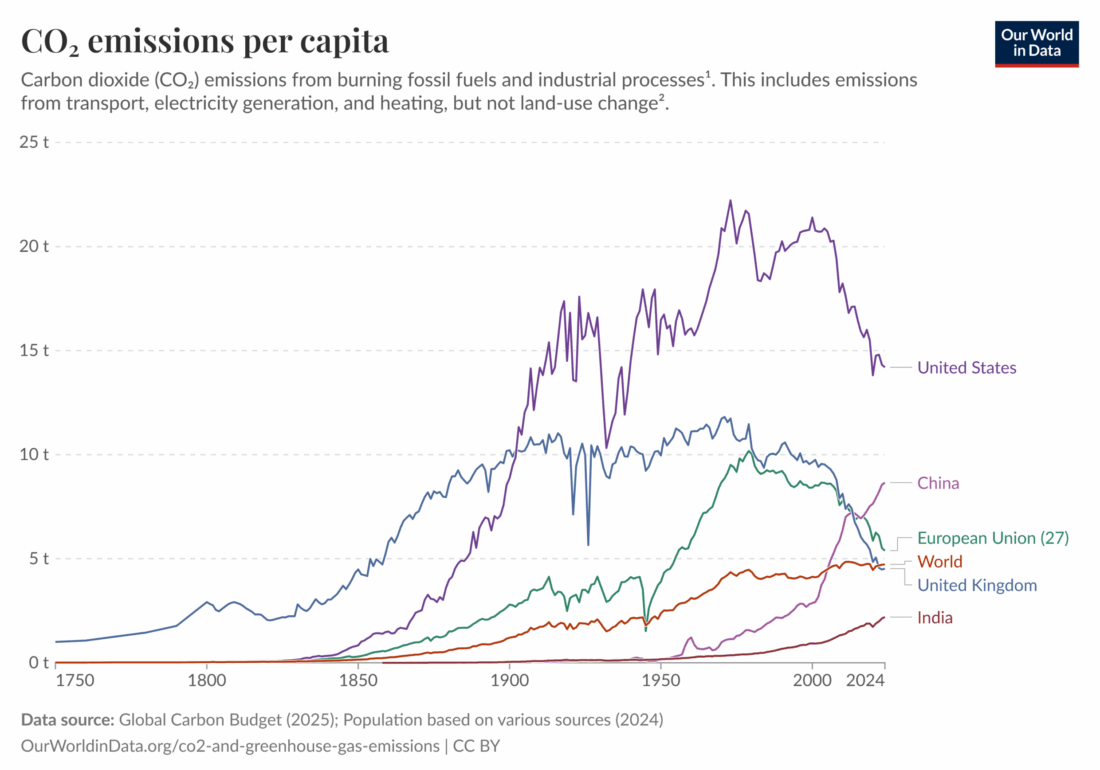 Figure 2
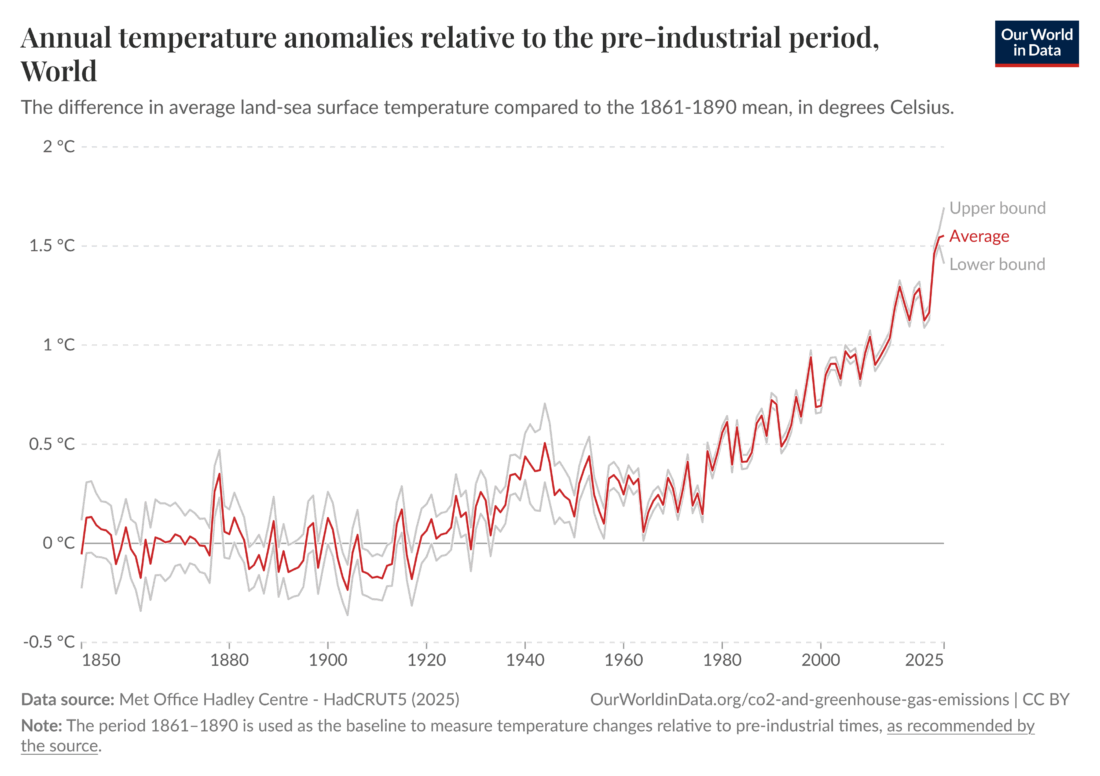 Figure 3
The last three graphs are taken from a summary of energy transitions in 2025 (The Energy Transition in 2025: What to Watch For – RMI). Again, the primary sources are included in the graphs.
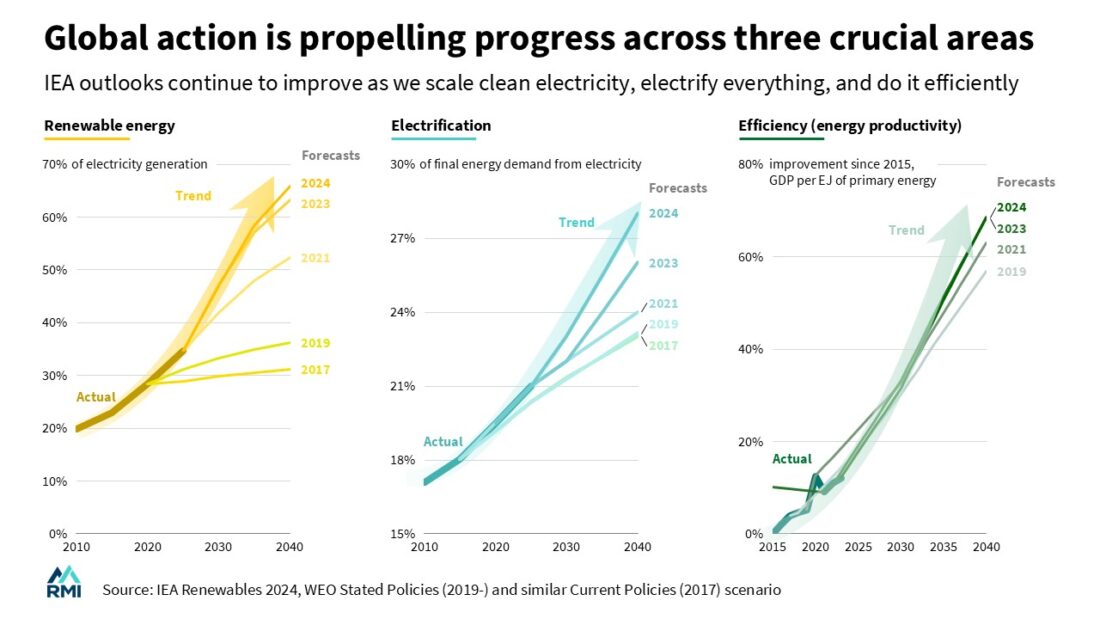 Figure 4
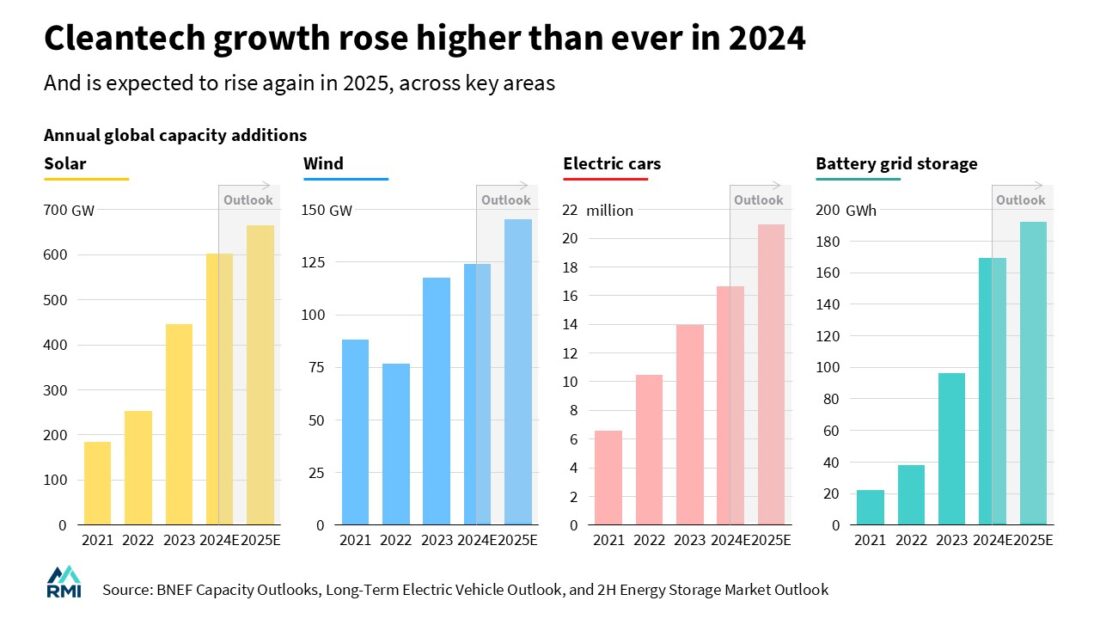 Figure 5
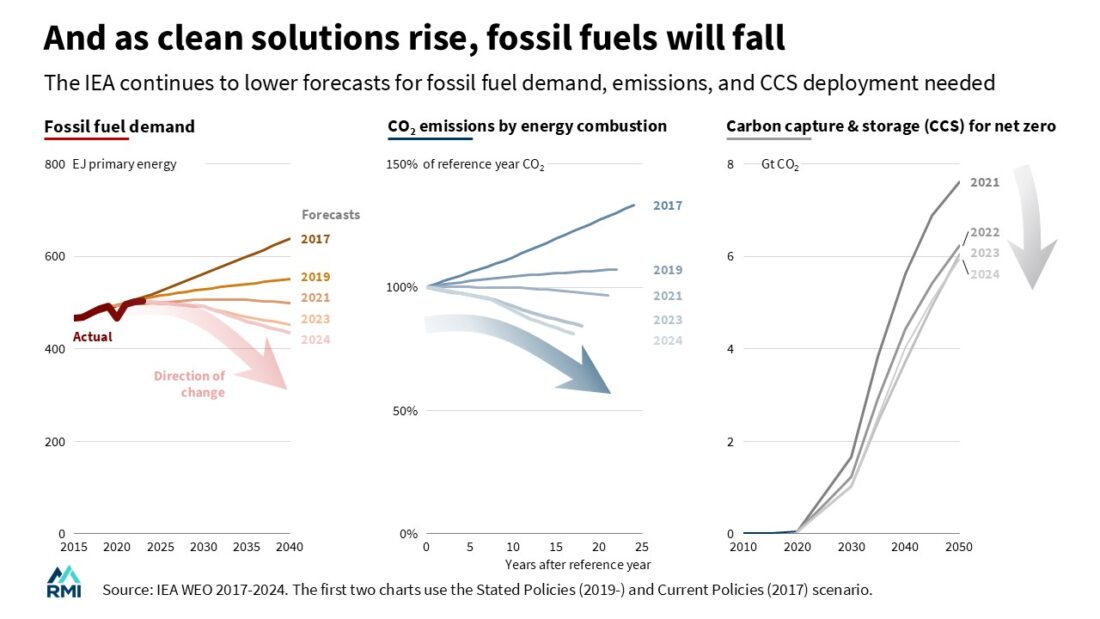 Figure 6
President Trump’s first term spanned the period of January 20, 2017 to January 20, 2021. His attitude toward climate change has been similar in his two terms, although it seemed a bit less intense in his first term compared to what he is showing now. A thorough examination of the six graphs above shows no indication that his policies have had any visible impact upon the trend towards clean energy. The prognosis is that the impacts of this term will be similar. The focus of the next blog will be on changes in leadership within the energy transition that have resulted directly from the Trump administration’s changing attitude.
Interesting article! It’s great to see how we can grow the economy while cutting carbon emissions. The mention of Trump’s policies shows how important it is to stay on track with climate progress.
Great post! I like how you explained everything in a clear and easy way.
The decoupling data from developed nations is striking. The fact that GDP kept growing while per-capita emissions dropped suggests the economic argument against the energy transition is losing its empirical footing, regardless of political positioning.
A Tipping Point in the Energy Transition: Decoupling the Increase in GDP from the Decrease in Carbon Emissions Smash Karts
Great breakdown of the data here! I really appreciated how you laid out the IPAT equation and then showed actual evidence that we’re already decoupling GDP growth from emissions in developed countries—it really drives home that the economy vs. environment argument doesn’t actually hold up when you look at the numbers. The graphs from 2025 showing the progress in clean energy and electrification are encouraging, especially when you contrast them with the current administration’s pushback. By the way, if anyone wants to dive deeper into some of the climate talks or energy transition documentaries, there’s a useful tool at https://youtubetomp3.xyz/ for downloading audio from YouTube videos if you prefer listening on the go.
https://youtubetomp3.xyz/
This is such a well-researched breakdown of what’s actually happening with the energy transition! I really appreciate how you laid out the IPAT equation and showed that economic growth and emissions reduction aren’t mutually exclusive—the data from 2025 clearly proves that. It’s frustrating watching the current administration ignore this progress, but like you said, they’re basically swimming against the current at this point. By the way, if anyone wants to stay on top of trends and statistics in real-time, checking out resources like Hockey Scoreboard Online (hockeyscoreboardonline.com) can actually help you track data visualization tools and trends, kind of like how you’re tracking energy data here!
https://www.hockeyscoreboardonline.com/
This was a really insightful read, especially seeing all the figures that show how we’re truly decoupling GDP from carbon emissions despite political resistance. It’s so encouraging to see the progress laid out
https://www.basketballscoreboardonline.com/
This was such a clear breakdown of why the “economy vs. environment” argument just doesn’t hold up anymore, especially with the figures you shared on decoupling GDP from carbon emissions. It’s really encouraging to see the global progress you highlighted, despite some political headwinds, and it actually reminds me a lot of the community-driven initiatives discussed on Hydra Heli 2 (https://hydraheli2.org/) – their work on local energy transitions is super relevant to this discussion.
It’s fascinating to consider the global shift towards decoupling GDP from carbon emissions. From my perspective working with digital file conversions, I often see how small efficiencies in digital processes can collectively contribute to larger resource
This was such a thought-provoking post, especially the idea of ‘swimming against the current’ when it comes to political denial versus the actual progress being made globally. It’s really encouraging to see
This was such an insightful read, especially the focus on the actual “current” of progress instead of just the political noise. It’s so encouraging to see the data, like in Figures 4 and 5, showing how much clean energy and electrification are growing, really underscoring that decoupling of GDP and emissions you talked about. My own community has been exploring solar and even some micro-grid projects lately, and it really feels like the momentum is genuinely building, despite the headlines. For anyone looking for practical resources or more in-depth info on sustainable energy solutions, I recently found https://hydraheli2.org/ really helpful. Thanks for putting this together, it’s a much-needed perspective!
The idea of a tipping point for decoupling GDP growth from carbon emissions is incredibly compelling. I’m curious about the specific technological advancements you see as most instrumental in achieving this – particularly how decentralized, efficient automation could play a role in optimizing energy consumption at the local level without heavy cloud reliance.
The idea of a ‘tipping point’ in decoupling GDP growth from carbon emissions is incredibly encouraging, and it makes me think about the practicalities of tracking this progress. So much of the energy
This is such an important analysis. The decoupling of GDP growth from carbon emissions is the kind of data-driven optimism we need more of in climate discourse. Too often the narrative is purely apocalyptic, when in reality there are genuine technological and economic shifts happening that deserve attention.
I see a similar pattern in the digital content space. AI tools are producing mountains of text and media that technically “exists” but contributes almost nothing meaningful — it’s the digital equivalent of greenwashing. If you’re frustrated by the flood of generic AI content online, check out [your AI slop bores me](https://youraislopboresme.ai/) for a refreshing take on calling out the noise.
The key insight in your piece is that decoupling isn’t automatic — it requires deliberate policy and investment. That parallel applies to so many other challenges we face. Excellent work!
The energy transition discussion here reminds me how important it is to engage communities around sustainability. Speaking of community engagement, our SCP merch shop supports fans who care about creative storytelling and world-building—much like how we need to build a shared vision for our energy future. Great analysis on decoupling GDP from emissions!
The idea of transformation in energy systems is fascinating—shifting from one model to another without losing efficiency. In a different context, AI Dress Changer lets you experiment with visual transformations instantly, showing how change and adaptation can be both practical and creative.
This is a really insightful breakdown of how economic growth can be decoupled from carbon emissions. Visualizing complex relationships like IPAT and energy transitions is crucial for understanding progress. NanoMaker AI is actually a great tool for turning complex data and ideas into interactive visual projects, which could make topics like this even more accessible.
This is exactly the kind of data-driven analysis we need on the energy transition. Decoupling GDP growth from carbon emissions has been the holy grail of climate policy, and seeing concrete evidence of progress is encouraging. The tipping point framework you use really helps contextualize where we are in this shift. Platforms like Kirkify (https://kirkifyai.ai/) are increasingly useful for processing this kind of complex environmental data.
This is exactly the kind of data-driven analysis we need on the energy transition. Decoupling GDP growth from carbon emissions has been the holy grail of climate policy, and seeing concrete evidence of progress is encouraging. The tipping point framework you use really helps contextualize where we are in this shift. Platforms like Kirkify are increasingly useful for processing this kind of complex environmental data.
Honestly, it’s wild how some folks still don’t get the urgency of this whole climate situation. I remember my grandpa used to say, ‘You can’t eat money,’ and I think about that every time I see these debates. If only everyone could see the long-term benefits of transitioning to cleaner energy, like the stuff discussed here. Check this out for more thoughts on it! https://mimov2.net/
The data on GDP decoupling from carbon emissions is really encouraging. Your IPAT equation breakdown makes it accessible. I’d love to see more visual data storytelling in climate communication – AI color analysis free could help create more impactful charts that drive the message home.
Excelente análisis sobre la transición energética. La desaceleración del carbono mientras crecen los GDP en países desarrollados es transformacional. VicSee puede ayudar a visualizar estas tendencias en videos explicativos.
I agree with your take on “A Tipping Point in the Energy Transition: Decoupling the Increase in GDP from the Decrease in Carbon Emissions – ClimateChangeForkClimateChangeFork”. With climate policy, Trump trying to swim against the current of progress. This feels relevant for builders working on related sites like https://www.animetactical.com/.
Instead of worrying, use this time to research the market and reposition your own capabilities.
The IPAT framing is useful here. It’s a hopeful reminder that solutions to the climate crisis can coexist with economic growth.
Policy headwinds matter at the margins, but the underlying economics of renewables have shifted so fundamentally that the transition has its own momentum now. That’s arguably the most important story of the last decade in energy.
The progressive flow of sustainable energy is redefining the geopolitical landscape.
The IPAT framing is useful here — breaking down CO2 emissions into those component variables makes it much easier to see where the real movement is happening. The decoupling of GDP growth from emissions growth in developed economies isn’t new, but the pace at which it’s accelerating is.
The point about Trump’s first term having no visible effect on the clean energy trend is worth dwelling on. Policy headwinds matter at the margins, but the underlying economics of renewables have shifted so fundamentally that the transition has its own momentum now. That’s arguably the most important story of the last decade in energy.
The harder question — and one the IPAT equation surfaces — is what happens when you factor in population growth and rising per-capita consumption in developing economies. Decoupling in the US or Europe is encouraging, but the global picture depends heavily on whether those economies can follow a different trajectory than the one wealthy countries took.
Looking forward to the next post on the leadership shifts in the transition.
It’s wild how some folks think clinging to fossil fuels will save jobs, right? Meanwhile, I just watched my neighbor install solar panels and their electric bill is almost zero now. Bet they’ll have plenty of cash for some fun stuff! You guys ever seen this kind of switch? fnf spaghetti
This is a really interesting article. The idea of decoupling GDP growth from carbon emissions is crucial for a sustainable future, and it’s great to see this being discussed.
This blog offers a compelling analysis of the global energy transition’s progress despite political resistance. The data-driven approach and focus on decoupling economic growth from carbon emissions are insightful and inspiring. A clear and concise presentation of the figures effectively highlights the resilience of sustainable energy advancements. Excellent work!
The analysis of A Tipping Point in the Energy Transition: Decoupli here is quite thorough. I especially appreciate the practical insights — they’re immediately applicable.
Your work continues to motivate people
I’ve been following this series closely, and this post clearly marks a shift from viewing energy as a scarcity problem to treating it as a management challenge. The discussion of surplus generation and negative pricing makes it clear that infrastructure, regulation, and demand coordination are now central to leadership.
Your comparison of financing models also helps explain why developing countries respond so differently to competing approaches. Looking forward to the next piece in this series.
i enjoy reading your article, such a great piece, keep up the good work, webdesign freelancer deutschland is the best webdesign freelacing service in Germany, you can check it out. Thank you
Response to Sprunki:
True. but the resolution of the graph is not good enough to specify exact date.
President Trump’s first term spanned the period of January 20, 2017 to January 20, 2021.
While the Trump administration’s stance on climate change is frustrating, the progress made in 2025 really shows that we don’t need to rely on fossil fuels for economic success. It’s a hopeful reminder that solutions to the climate crisis can coexist with economic growth.
Your work continues to motivate people. Really grateful for creators like you who care deeply