One month ago, on February 25th, I wrote a blog that attempted to differentiate between the long- and short-term impacts of evolving global trends. I wrote that I would try to focus on the long-term impacts. The Iran war started on February 28th. In the blog that followed (March 4th), I wrote that only time can tell how long this war will last. I decided not to label the expected timing of its impact until the picture became clearer. It appears now that some long-term consequences are starting to emerge from this war. This blog focuses on the emerging vulnerability of the global energy supply, which can be addressed by accelerating the energy transition to solar-based sources. We can do this irrespective of our opinions on the climate-changing impacts of burning fossil fuels. The global shift to sustainable energy didn’t start with the fear of climate change impacts on carbon dioxide emissions. The transition was summarized in Wikipedia the following way:
After the 1973 oil crisis, the term energy transition was coined by politicians and media. It was popularised by US President Jimmy Carter in his 1977 Address on the Nation on Energy, calling to “look back into history to understand our energy problem. Twice in the last several hundred years, there has been a transition in the way people use energy … Because we are now running out of gas and oil, we must prepare quickly for a third change to strict conservation and to the renewed use of coal and to permanent renewable energy sources like solar power.”[19] The term was later globalised after the 1979 second oil shock, during the 1981 United Nations Conference on New and Renewable Sources of Energy.[20]
From the 1990s, debates on energy transition have increasingly taken climate change mitigation into account. Parties to the agreement committed “to limit global warming to “well below 2 °C, preferably 1.5 °C compared to pre-industrial levels”.[21] This requires a rapid energy transition with a downshift of fossil fuel production to stay within the carbon emissions budget.[22]
So, it started in a crisis in the Middle East in 1973 in response to a supply crisis that emerged out of Arab oil embargo that came in response to the Yom-Kippur war between Egypt and Israel. The analogies between the start of the energy transition and the present situation were summarized by two publications, from which key paragraphs are cited below:
When Middle Eastern wars sparked an oil crisis in the 1970s, tripling energy prices and throwing economies into chaos, some countries looked beyond short-term solutions. The French made nuclear the pillar of their power system. Scandinavians insulated buildings and funnelled waste heat into homes. The Dutch built bike lanes where others wanted motorways. The Danes developed wind turbines.
Such steps cleaned filthy air and cut imports from autocrats but took a back seat when Russia invaded Ukraine half a century later. Europe raced to buy gas from the US and Middle East. Policies to roll out renewables by cutting red tape helped reduce dependence, but calls to use less energy and reduce waste were muted. Industry lobbying and populist backlash have since sabotaged efforts to phase out petrol cars and fossil boilers.
In October 1973, oil-producing countries in the Middle East imposed an oil embargo, among other measures, on the United States and other countries that had supported Israel during the Yom Kippur war.
Gasoline prices skyrocketed, and President Richard M. Nixon took emergency measures to limit consumption. Gas stations rationed supplies, leading to long lines, complaints of price gouging, and what The New York Times called “chaotic” situations. In Europe, some countries banned driving on Sundays, and Japan, heavily dependent on oil imports, declared a state of emergency.
Figures 1 – 3 summarize the present global distribution of fossil fuels, while Figure 4 summarizes the present (2022) percentage of renewable energy out of each country’s total energy use.
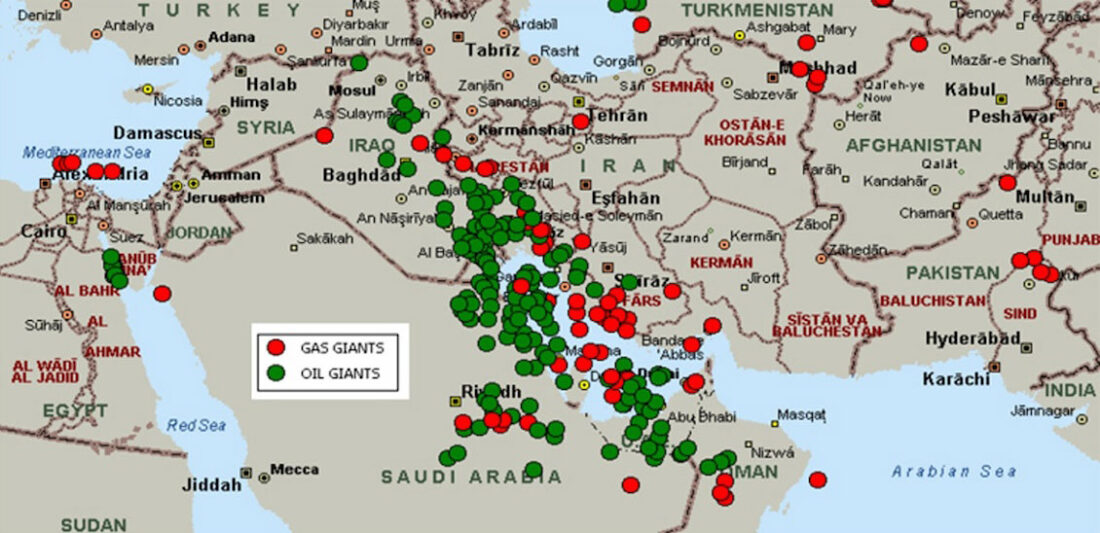 Figure 1 – Map of oil and gas reserves in the Middle East (Source: GEO ExPro)
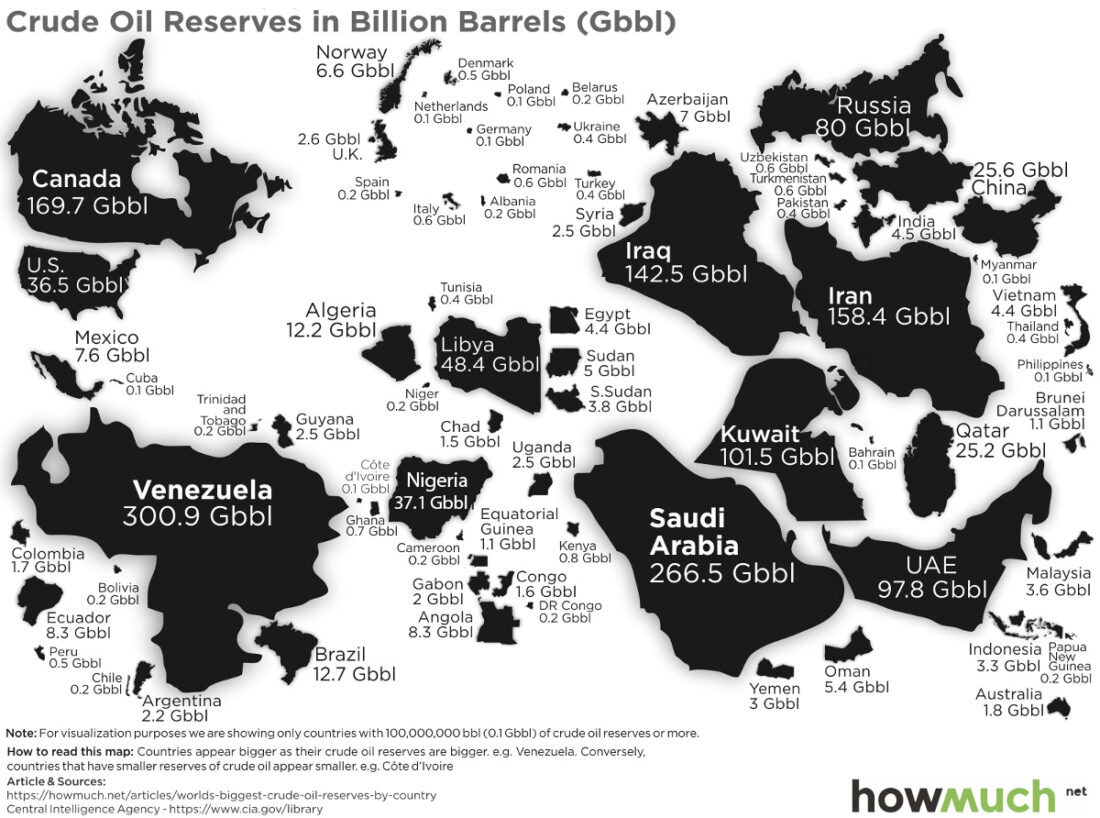 Figure 2 – Global distribution of oil reserves (Source: Visual Capitalist)
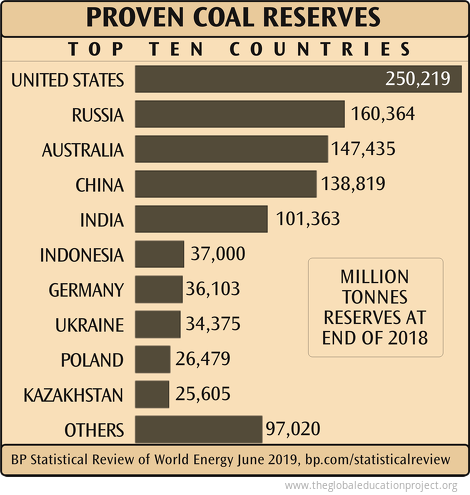
Figure 3 – Distribution of the world’s largest coal reserves (Source: The Global Education Project
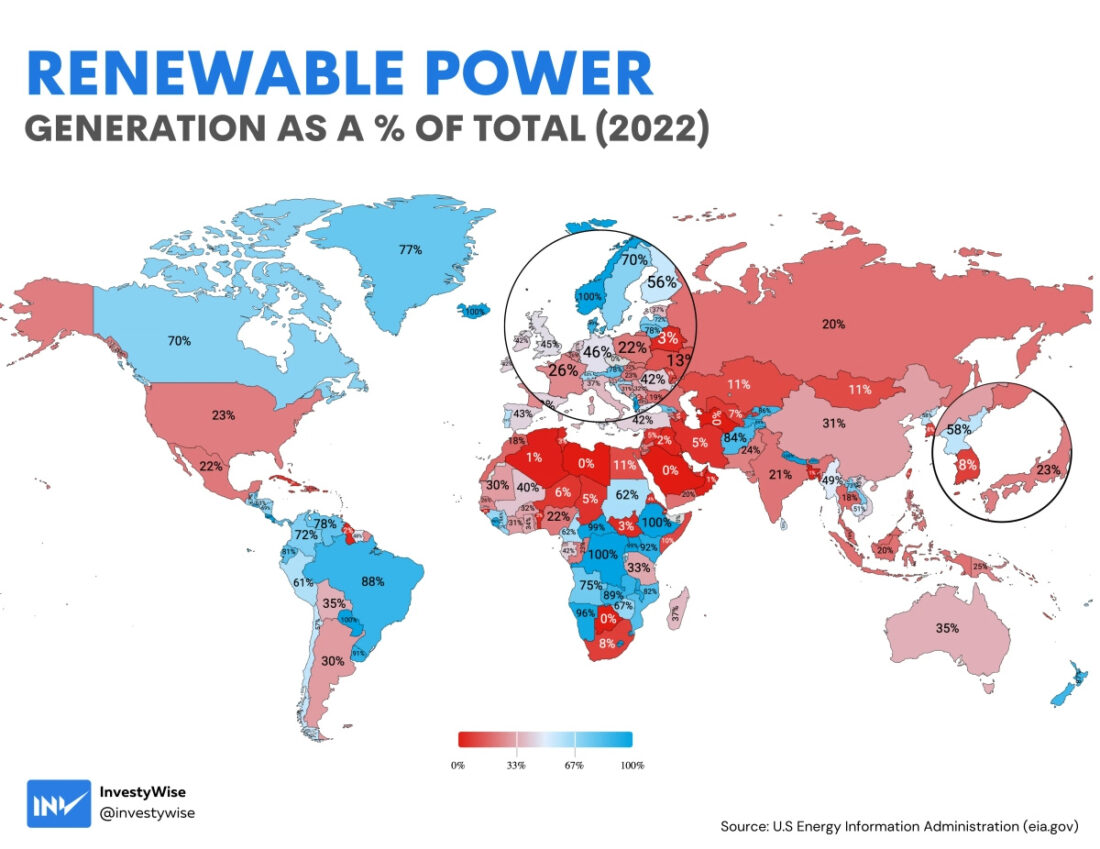 Figure 4 – Renewable energy as a percentage of energy use by country (Source: Visual Capitalist)
Each country’s percentage of renewable energy use in Figure 4 depends on how they have chosen to handle their cache of non-renewable energy sources. The global distribution of these resources, as shown in Figures 1-3, came out of geological processes independent of any human decisions. As we can see, some of these differences have serious security implications, as outlined by the NYT below:
War with Iran has frozen commerce in the Persian Gulf and boosted oil prices by more than 50 percent worldwide, translating almost immediately into higher gasoline costs. It’s the largest global oil disruption ever and is likely to accelerate inflation throughout this year. And yet, in the United States, the impact is much more muted than it would have been a few decades ago. That’s in part because America uses less energy per unit of economic output than it used to. In economist-speak, the U.S. economy is less “energy intensive,” for a few reasons.
The global sensitivity to energy sourcing is different now than it was in 1973. Comparison of the dependence on the energy sources can be expressed in numbers (extracted from AI through CoPilot) that are summarized in Table 1:
Table 1 – Comparison of Global Socioeconomic Indicators in 1973 and 2025 2.8*1011kWh/1 Exajoules
| Socioeconomic Indicators | 1973 | 2025 |
| Population (in Billions) | 4 | 8.2 |
| Primary energy use (Exajoules) | 238 | 630 |
| Primary Energy use per Capita (kWh/Capita) | 22,000 | 26,000 |
| GDP (nominal US$ in Trillions) | 4 | 112 |
| GDP (constant US$ in Trillions) | 4 | 16 |
The differences can be summarized as a doubling of global population, an almost tripling of primary energy use, approximately the same energy use/person and a quadrupling of energy intensity (GDP/Energy use), if GDP is measured in constant US$.
What is not mentioned in Table 1 is the change in dependence on fossil fuels for energy sourcing. In 1973, the world was completely dependent on fossil fuels for its energy supply. In contrast, as Figure 4 shows, we now have choices, independent of our beliefs in or skepticism of consequential climate change. As some people are now starting to realize, the dynamic of digitization that was discussed in the previous three blogs is starting to become dependent on the energy choices that we make. A wakeup call on this issue is shown below:
Americans’ electricity costs rose by 30% between 2021 and 2025 and show no signs of going down. And with the war in Iran threatening the global oil supply, and data centers pushing up energy demands and prices, the cost of energy is almost guaranteed to increase even more.
In an unlikely collaboration, Google and Tesla are paying attention to Americans’ unease and sentiment. The two companies announced on Tuesday they are partnering to lower electricity costs and improve the efficiency of the electrical grid. The two Silicon Valley giants are joining HVAC powerhouse Carrier, data center builder Verrus, electrical panel startup Span, and energy distributors Renew Home and Sparkfund, to form a coalition called Utilize.
In the next few blogs, I will continue to follow developments in terms of how the Iran war is currently serving as a wakeup call for continuing energy supply changes.