Just as the Anthropocene is global, so its governance must be as well. Of course, this is easier said than done; countries are the only sovereign entities we have, meaning that any such global governance can only be attained through consensus.
Worldwide environmental issues such as the anthropogenic destruction of stratospheric ozone and the anthropogenic chemical changes that we inflict on the atmosphere, are early manifestations of an ill-governed Anthropocene. We are dealing with the uneven geographical distribution of the security burden that has resulted from broken states and their fleeing refugees. On another facet, there are economic opportunities that serve as manifestations of the present global flux and likewise lead to massive migrations. Understanding of the global forces in action is vital – not only for those assigned the responsibility of governing but also for those that elect them.
The attempt to introduce a common core in the American educational system was strongly motivated by the fact despite our vast available resources, US students lag behind those educated elsewhere, even in places with fewer funds to devote to schooling.
It is time to take a better look at international education efforts.
By their nature, educational systems are local. We cannot look at the educational efforts of close to 200 countries on this platform. Instead, I will focus on the US in comparison to nine other countries that together constitute about 60% of the world population. The countries are listed in the table below:
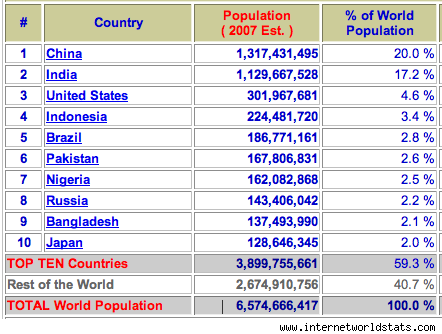 Table 1 – List of the world’s 10 most populous countries.
Wikipedia breaks down its international rankings into 10 different categories; it lists 13 sections within the category of education and innovation. International rankings are based on either equivalent tests within comparable groups of students or on surveys of people’s opinions from different countries. Table 2 shows a comparison of both sets of results. The educational ranking and the country ranking columns are based on US News surveys and the PISA (Programme for International Student Assessment) columns are based on equivalent tests.
| Country | Educational ranking | Country ranking | PISAMath | PISAScience | PISAReading |
| China (as represented by Shanghai) | 22 | 17 | 613* | 580* | 570* |
| India | 29 | 22 | |||
| US | 3 | 4 | 481 | 497 | 498 |
| Indonesia | 44 | 42 | 375 | 382 | 396 |
| Brazil | 27 | 20 | 391 | 405 | 410 |
| Pakistan | 59 | 56 | |||
| Nigeria | 58 | 57 | |||
| Bangladesh | |||||
| Russia | 20 | 24 | 482 | 486 | 475 |
| Japan | 8 | 7 | 536 | 547 | 538 |
Table 2 – Educational ranking, country ranking and PISA scores (2012) of the most populated countries.
The data in the first two columns is based on surveys:
- The Best Countries for Education are ranked based on scores on a compilation of three equally weighted country attributes: has top quality universities, well-developed public education system and would consider attending university there.
- The Best Countries ranking evaluates 60 countries across 24 rankings drawn from a survey of more than 16,000 global citizens.
The methodology of the PISA tests is as follows:
Each student takes a two-hour handwritten test. Part of the test is multiple-choice and part involves fuller answers. There are six and a half hours of assessment material, but each student is not tested on all the parts. Following the cognitive test, participating students spend nearly one more hour answering a questionnaire on their background including learning habits, motivation, and family. School directors fill in a questionnaire describing school demographics, funding, etc. In 2012 the participants were, for the first time in the history of large-scale testing and assessments, offered a new type of problem, i.e. interactive (complex) problems requiring exploration of a novel virtual device.
The US News ranked 60 countries. England came first in country ranking and 3rd in educational ranking. Iran is last in terms of education. All 10 of the most populous countries except for Bangladesh show up on the list.
The PISA (Programme for International Student Assessment) is based on testing 15 year olds in 65 countries – including OECD and affiliated countries. India, Pakistan, Nigeria, and Bangladesh are not on the list. More than that, China is represented solely by Shanghai. Indeed, all the top rated “countries,” in addition to Shanghai, are the Chinese cities of Hong-Kong, Taipei, Macao and the City State of Singapore. Shanghai certainly doesn’t qualify to be in our table but the inclusion has been widely adopted with a clarifying comment. The OECD average PISA scores are 494 in math, 501 in science, and 496 in reading. That puts the US score slightly below the OECD average in math and slightly above it in science and reading.
| Country | Global ranking | 100,000*Educational Index (2013)/GDP/Capita(2014) |
| China | 7.67 | |
| India | 29.9 | |
| US | 28 | 1.63 |
| Indonesia | 69 | 17.3 |
| Brazil | 60 | 5.64 |
| Pakistan | 22.9 | |
| Nigeria | 13.3 | |
| Bangladesh | 41.1 | |
| Russia | 34 | 6.12 |
| Japan | 4 | 2.43 |
Table 3
*Global country ranking and Educational Index normalized to the countries’ GDP.
Table 3 provides two kinds of additional scores: The Global ranking column, published by the OECD and reported by BBC, ranks performance in math and science. This ranking is based on an amalgamation of international assessments, including the OECD’s PISA tests, the TIMSS tests run by US-based academics, and TERCE tests in Latin America, putting developed and developing countries on a single scale. The top five places are all taken by Asian countries – Singapore, Hong Kong, South Korea, Taiwan and Japan. The BBC site included the following comment:
“These countries are also very good at attracting the most talented teachers in the most challenging classrooms, so that every student has access to excellent teachers.”
I personally compiled and normalized the Education Index of the 10 most populous countries according to their GDP/Capita.
Education index EI is calculated from “Expected years of schooling” EYS (Number of years a child of school entrance age can expect to spend in a given level of education) and “Mean years of schooling” MYS (Average number of completed years of education of a population [25 years and older]). “Expected years of schooling” is indexed by dividing by 18 and “Mean years of schooling” is indexed by dividing by 15. Education index is obtained by averaging these two indices. The maximum for “Mean years of schooling”, 15, is the projected maximum of this indicator for 2025. The maximum for “Expected years of schooling”, 18, is equivalent to achieving a master’s degree in most countries.
In other words, the Educational Index is based on effort – not on achievement by students or an inspiration where to study.
The GDP/Capita data were taken from the World Bank.
It should be clear from the last column in table 3 that the poorest developing countries actually spend a considerably larger percentage of their resources on education than the rich OECD countries. In fact, the US is the lowest on this scale.
This month my wife and I will travel to Europe – including England, France, and Poland. I will also visit both Israel (where I have family and friends) and the island of Malta, where I will meet my Australian family; it is winter for them and they wanted a taste of warmer weather. During the trip, aside from the social aspects, I will try to delve into the massive migration from the Middle East and Africa that is overwhelming Europe. As I discussed in the context of last summer’s trip to China (July 21 – November 10, 2015), the promise of better educational opportunities is a strong driving force for people to leave their countries. Poor countries are well aware of this potential “brain drain,” a factor that likely serves as one of the strongest incentives to put as many resources in their educational system as they can.