Last month (November 22), I promised I would focus on some of the non-racial factors that significantly impacted the presidential elections. Last week’s blog explored educational aspects and today’s post will look at the urban/rural divide. The four figures below summarize the data.
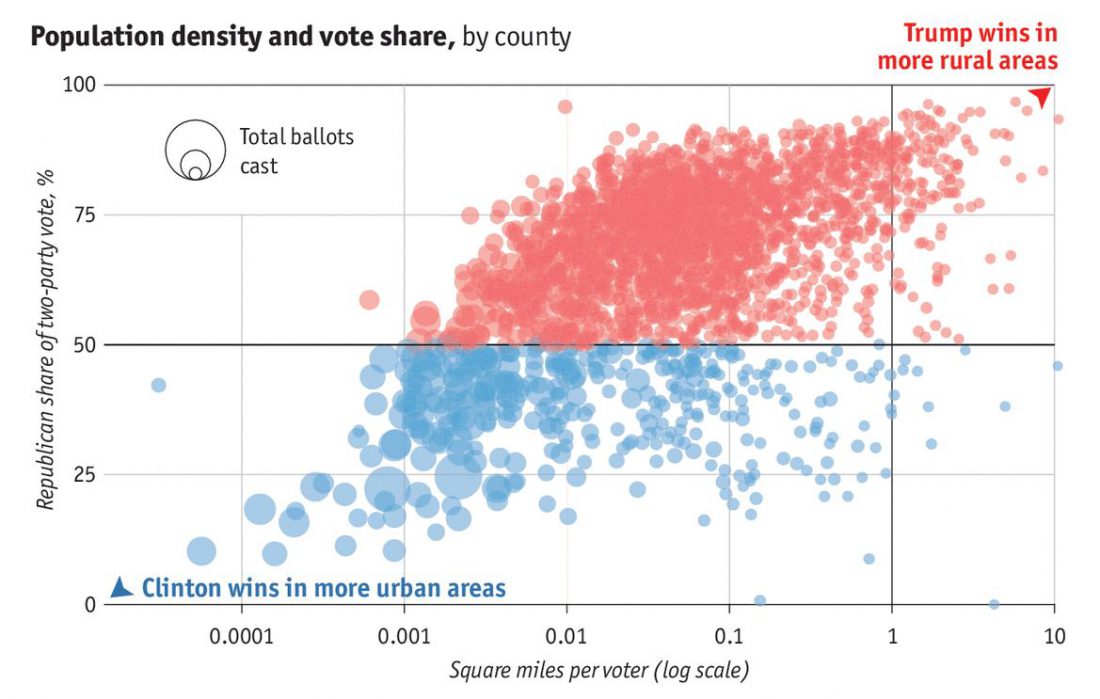
The first figure, taken from the Economist (the original sources were not specifically accredited within the article), provides the most complete description because it presents voting preferences as a function of a proper, measurable, non-confrontational variable: voter density (the reciprocal is square mile per voter). The scale is logarithmic (August 6, 2012 blog) to represent the extreme differences between high density urban populations and low density rural populations.
It is unfortunate that the data in the figure focus on density of voter population rather than that of the general population but in this case it is safe to assume that both are highly correlated.
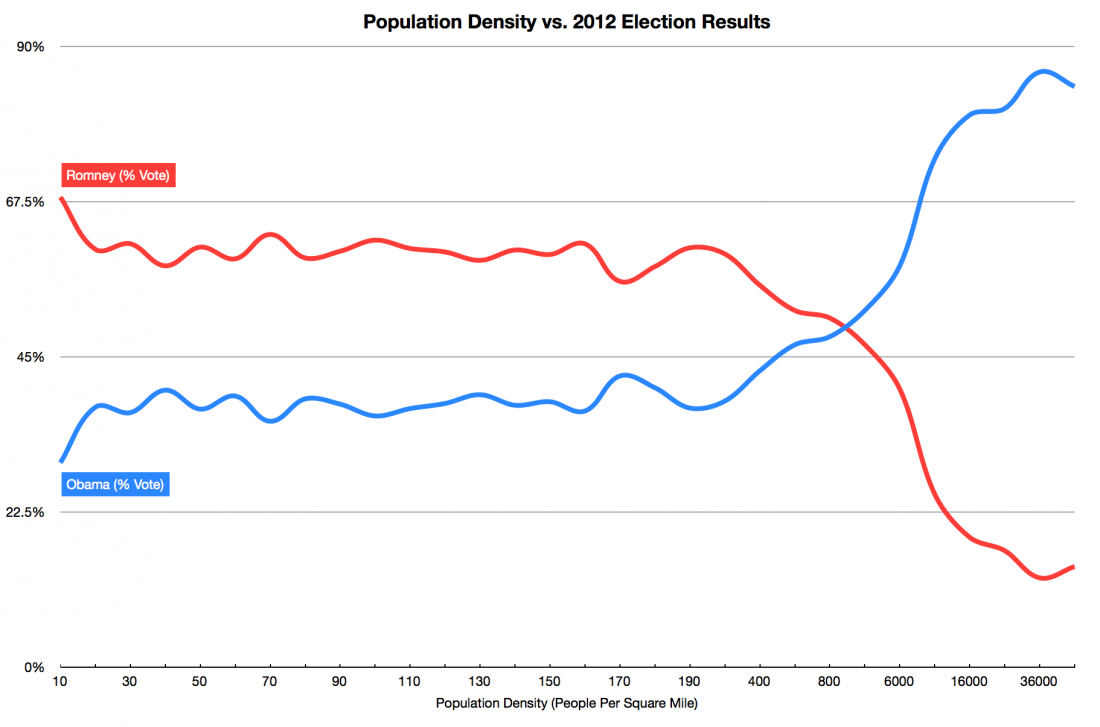
Is this sharp divide a Trump effect? Figure 2, which provides similar data from the 2012 elections clearly shows via total population density that this is not the case. The scale that they chose to use for Figure 2 is especially interesting (and somewhat suspicious) once you look closer. The horizontal scale is linear (a constant of 20 people per square mile) almost until the red and blue lines intersect, at which time it converts sharply into a non-linear logarithmic scale. Even after employing this kind of ruse, Figure 1 shows data for 6 orders of magnitude change in population density while Figure 2 shows data for variations that span less than 5 orders of magnitude. Proper scaling would require a repeat of the logarithmic scaling shown in Figure 1, which would (more accurately) show a much smoother transition between rural and urban voters.
Meanwhile, the definitions of what constitute urban or rural areas can be controversial and somewhat arbitrary. Urban areas are usually associated with city populations, however, city boundaries often originate from political decisions. I ran across this difficulty when my students tried to calculate contributing factors to climate change through the IPAT identity (November 26, 2012) [Yevgeniy Ostrovskiy and Michael Cheng and Micha Tomkiewicz; “Intensive and Extensive Parametrization of Energy Use and Income in US States and in Global Urban Environments,” The International Journal of Climate Change: Impacts and Responses, Volume 4, Issue 4, pp.95-107.(2013)]. In that instance, we couldn’t find data that listed the indicators in a continuous way throughout density variations. We will try to revisit this project with different students to see if we can find more conclusive information.
Here is how the Census Bureau defines rural and urban:
Source: US Census Bureau
Released: Oct. 1995
URBAN AND RURAL
The Census Bureau defines “urban” for the 1990 census as comprising all territory, population, and housing units in urbanized areas and in places of 2,500 or more persons outside urbanized areas. More specifically, “urban” consists of territory, persons, and housing units in:
- Places of 2,500 or more persons incorporated as cities, villages, boroughs (except in Alaska and New York), and towns (except in the six New England States, New York, and Wisconsin), but excluding the rural portions of “extended cities.”
- Census designated places of 2,500 or more persons.
- Other territory, incorporated or unincorporated, included in urbanized areas.
Territory, population, and housing units not classified as urban constitute “rural.” In the 100-percent data products, “rural” is divided into “places of less than 2,500” and “not in
places.” The “not in places” category comprises “rural” outside incorporated and census designated places and the rural portions of extended cities. In many data products, the term “other rural” is used; “other rural” is a residual category specific to the classification of the rural in each data product.
In the sample data products, rural population and housing units are subdivided into “rural farm” and “rural nonfarm.” “Rural farm” comprises all rural households and housing units on farms (places from which $1,000 or more of agricultural products were sold in 1989); “rural nonfarm” comprises the remaining rural.
The urban and rural classification cuts across the other hierarchies; for example, there is generally both urban and rural territory within both metropolitan and nonmetropolitan areas.
Based on these definitions, the rural/urban 2016 election divide can be simplified to resemble Figure 3 (http://www.npr.org/2016/08/18/490240652/is-rural-resentment-driving-voters-to-donald-trump):
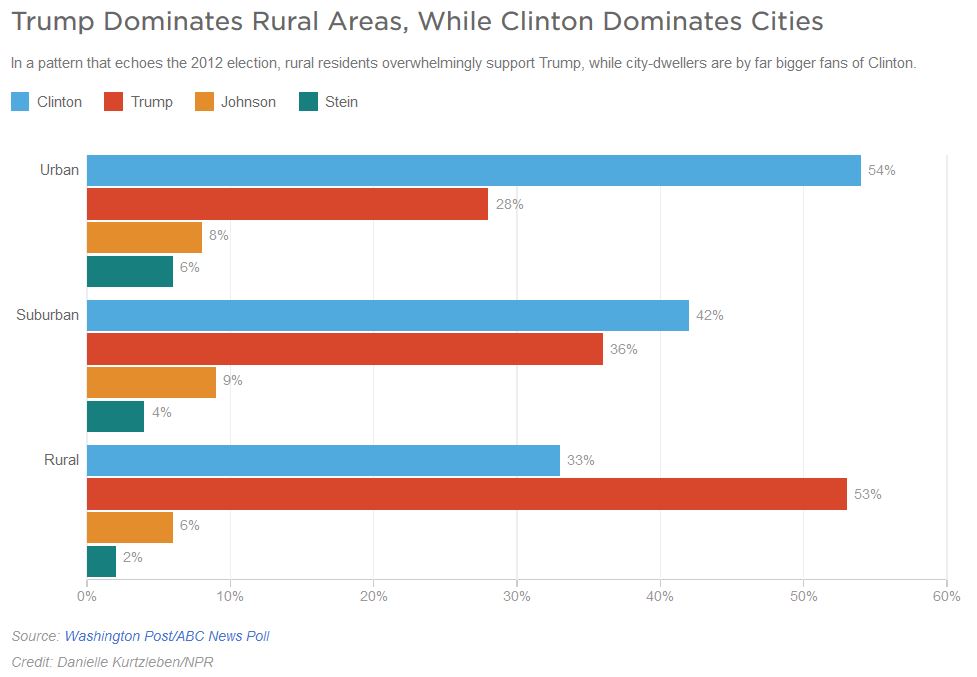 Figure 3 – Blue: Clinton; Red: Trump; Yellow: Johnson; Green: Stein
In the election results shown in Figures 1 and 2, the rural/urban patterns look similar. In both elections, the Democrats won a small majority of the popular vote but – as we’ve discussed (November 1, 2016), the electoral vote is the deciding factor. Donald Trump clearly won that race this year as Barack Obama did in 2012.
One of the most pressing issues is the reason for the persistently sharp rural/urban split. This became a key talking point for an increasing number of commentators, but I have to admit that I still don’t have a satisfying answer that can account for it.
Nor is this specific to the United States. One of the most striking impacts of the Anthropocene period is rapid global urbanization, which I will discuss next week. Figure 4 shows some historic data about this trend in the US:
 Figure 4 – US Rural and Urban Population Chart from Climate Change Impacts on the United States: The Potential Consequences of Climate Variability and Change , published in 2001
The numbers clearly show that, as in the rest of the world, people are flocking to cities, which now comprise an overwhelming majority of the country’s population. Yet the rural populations in a few states can still shift presidential elections. This has caused many (on the losing side) to start grumbling about dissolving the Electoral College – something that I have argued against (November 1). Here is what the NYT’s Emily Badger recently wrote about it:
The Democratic candidate for president has now won the popular vote in six of the last seven elections. But in part because the system empowers rural states, for the second time in that span, the candidate who garnered the most votes will not be president.
Rural America, even as it laments its economic weakness, retains vastly disproportionate electoral strength. Rural voters were able to nudge Donald J. Trump to power despite Hillary Clinton’s large margins in cities like New York. In a House of Representatives that structurally disadvantages Democrats because of their tight urban clustering, rural voters helped Republicans hold their cushion. In the Senate, the least populous states are now more overrepresented than ever before. And the growing unity of rural Americans as a voting bloc has converted the rural bias in national politics into a potent Republican advantage.
“If you’re talking about a political system that skews rural, that’s not as important if there isn’t a major cleavage between rural and urban voting behavior,” said Frances Lee, a professor of government and politics at the University of Maryland. “But urban and rural voting behavior is so starkly different now so that this has major political consequences for who has power.
As Figure 4 demonstrates, the urban population is rapidly increasing, largely by means of migration. These newer urban dwellers are often exposed to minorities and immigrants more than their rural counterparts, as well as being forced to adapt faster to change. These interactions have become major markers in recent elections.
Significant fragments of the decreasing rural populations love their settings and have no desire to mingle with the city crowds. They cling to the past, wanting to recreate bygone conditions that would enable them to have what they believe (or were told by their parents) to be good life. This subset doesn’t like the changes taking place that apparently benefit the cities. Therefore, since the migration from rural to urban areas does take place, an important question is the nature of the clustering; i.e. who is moving. When I examined this, I noticed that these migrating constituencies include especially high percentages of (college educated) professionals and young people.
As we’ll see next week, on a global scale this urbanization process is not necessarily restricted to clustering at the top; rather, the main transplants are simply those looking for better jobs. Some of these newcomers are international immigrants who settle in poorer neighborhoods in search of better economic opportunities for themselves and their families. While sovereign countries can block some such immigration, in-country migration is subject to fewer restrictions. This means that the people who stay behind in the countryside include increasing numbers of older people who for various reasons did not attend college. In essence, this creates two new countries: one looking to the future and the other which strongly dislikes that future and has the power to slow down progress. Our Founding Fathers constructed the electoral system the way that they did specifically to force the government to pay attention to the rural population.
This analysis is far from complete; almost half of the electorate – about 100 million eligible voters – didn’t bother to vote, so they are not included in these data. In fact, at the moment I know more about rural/urban voter participation in India than I know about the distribution of these voters in the US. I will endeavor to fix that gap in my knowledge.
As the country becomes more diverse, the Republican Party could have a harder time winning without more of the nonwhite vote. But it also poses a problem for Democrats. Racking up the popular vote in cities but tanking in rural and suburban areas could result in a repeat of this election: Solid blue states turning red by slim margins.
This demographic shift, in combination with increasing urbanization, may present us with bizarre election scenarios in the future.