Last week, I looked at a new NYC law that lays out a mandated schedule for buildings larger than 25,000ft2 to reduce their carbon footprints. I also gave an example of an exercise that I give my students, which shows how to calculate your own energy use and carbon footprint and correlate them with the emissions of larger groups of students, NYC, the US, and the world. I mentioned that a previous law had already mandated buildings declare their carbon footprints to the City—calculated on the basis of their energy use. The new law includes heavy fines for non-compliance, so—while I may teach how to estimate our carbon footprints based on first principles—the important part is how the City counts those emissions.
A special NYC site that contains more information on the new law condenses this issue into one important question, which gives us a look at their method of quantification: How much carbon comes from each type of energy?
The building emissions law sets specific emissions factors for the 2024-2029 limits. It also requires that emissions factors applicable for the 2030 limits be set by rule no later than January 1, 2023.
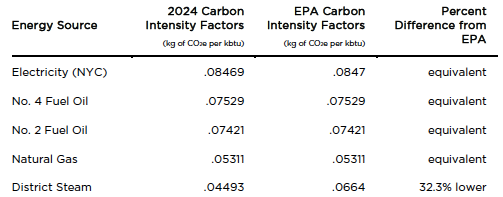
For the 2024-2029 limits, the law sets electricity as the most carbon-intensive energy source per unit of on-site energy. These coefficients, except for district steam, align with the coefficients used in the EPA’s Portfolio Manager and the EPA eGRID 2016 coefficients, shown in the table below:
Owners will also have the option to calculate electricity carbon intensity based on time of use. Further details will be specified in Department of Buildings rules.
The practice of correlating the connection between energy use and carbon footprints provides a good starting place for my students, as they calculate these carbon intensity factors from the chemical composition and the nature of the delivered energy.
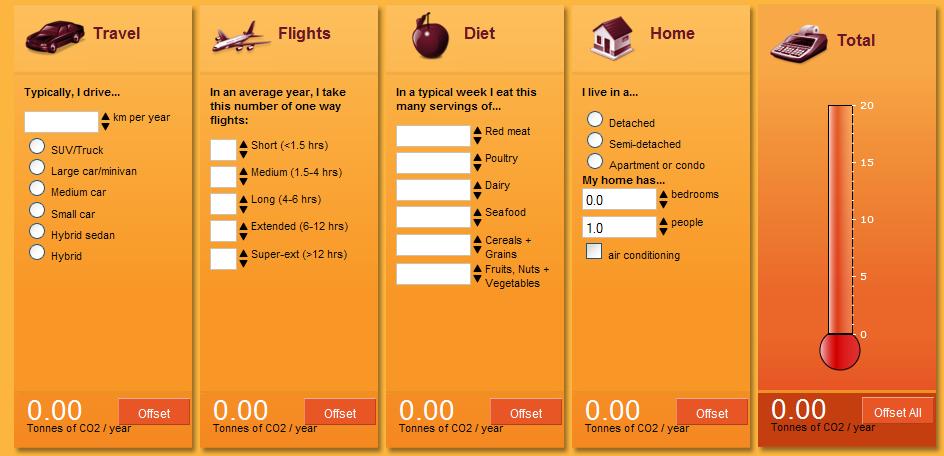
Imagine that you want a quick way to find your own carbon footprint and some quantitative recipes and suggestions for how to reduce it with as little “suffering” as possible. The EPA (Environmental Protection Agency) website provides carbon footprint calculators, which are a good place to start.

Example of a simple online carbon-footprint calculator
Meanwhile, the ENERGY STAR site provides some of the most extensive and recognizable information regarding how you can limit your carbon footprint without sacrificing the conveniences that enrich modern life:
ENERGY STAR® is the government-backed symbol for energy efficiency, providing simple, credible, and unbiased information that consumers and businesses rely on to make well-informed decisions. Thousands of industrial, commercial, utility, state, and local organizations—including nearly 40% of the Fortune 500®—partner with the U.S. Environmental Protection Agency (EPA) to deliver cost-saving energy efficiency solutions that protect the climate while improving air quality and protecting public health. Since 1992, ENERGY STAR and its partners have helped American families and businesses save 5 trillion kilowatt-hours of electricity, avoid more than $450 billion in energy costs, and achieve 4 billion metric tons of greenhouse gas reductions. Over the lifetime of the program, every dollar EPA has spent on ENERGY STAR resulted in $350 in energy cost savings for American business and households. In 2019 alone, ENERGY STAR and its partners helped Americans save nearly 500 billion kilowatt-hours of electricity and avoid $39 billion in energy costs.
One section in my book (Climate Change: The Fork at the End of Now | Momentum Press) is called, “Trivialities Add Up.” It details the energy involved in the flashing clocks on VCRs (the book came out in 2011), making ice,jj and appliances that stay plugged in for immediate access. The TV that I discuss there draws 40 watts of electricity. I estimate that, as of 2011, the US spent around 9.8×10¹⁰ kWh/year on electricity for this particular “luxury.”
My campus moved all classes online in March 2020 due to COVID-19 and our plans for the coming fall semester are still uncertain. Our campus is not completely empty of students but it is close; most have shifted to using their internet at home. Last summer (July 7, 2020), I described my students’ efforts to compare energy use before and during NYC’s lockdown to evaluate the school’s normal student-dependent energy use. The effort continues. One important aspect of this study has been locating network-connected electronic appliances that never turn off completely. Not surprisingly, there are many of them.
The two sites below describe energy use of many of these gadgets
How Much Electricity Does Your PC Consume?
Energy Use Calculator
Hopefully, in the near future (before the campus returns to in-person learning), we will be able to analyze the cost of at least leaving these gadgets in some sort of hibernation using the “Kill A Watt” power meter.
Let’s assume that an average individual private office space is 200ft2 in size, with one desktop computer rated at 200 watts—or 5 watts on “standby” or “sleep” mode. Given the pandemic, no one has visited this office or touched this particular computer for more than a year. If we calculate the energy this computer is using while left on standby, we see that we are wasting 0.005 kw*360*24 = 43 kWh of energy over that one-year period. Using the carbon intensity factors of electricity shown in the beginning of the blog, we can convert this energy waste into the idle computer’s carbon footprint for the year:
(0.08469 kg CO2/kbtu)*(3.412 kbtu/kWh)*43 = 12.4 kg CO2.
If we want to know by square foot, 12.4 kg CO2/ 200 ft2 = 0.062 kg CO2/ft2. This amount composes 1.5% of the emissions we will allow by 2024 (see last week’s blog). This may seem like a small amount but it serves nobody! While it is certainly better than leaving the computer running at full capacity the whole time, perhaps we can find an option for turning it off completely if no one is expected to use it for months at a time.
You can find much larger savings by following some of the suggestions provided in the following two sites:
Bob Vila
You turn off lights when you leave a room, combine errands to stretch a tank of gas, and run only full loads in your dishwasher. Yet even if you’re following the basics of home energy conservation, whether to save the earth or just save some cash, there’s still more you could be doing. In fact, chances are you still have a few bad energy habits that are leading to higher utility costs…
All those electronic gizmos that make modern life so convenient have a downside: They quietly suck energy even when not in use. Indeed, these so-called “vampire” or “ghost loads”—reflected in every small, unblinking red or blue light on your home electronics—may account for up to 10 percent of total energy use in a typical household. The most common culprits include cordless telephones, answering machines, computers, printers, televisions, and cable boxes. Turn them off or unplug them when not in use to save precious energy—and dollars.
Networx
Heat Follows Cold
If it’s 98 degrees outside but (thanks to central air conditioning) a comfy 72 degrees inside your house — and you open a window, the heat from outside will jump right in through the window and keep jumping in until it’s just as hot inside as it is outside. Like water, heat constantly seeks equilibrium; heat moves to cold until everything is the same temperature.Since you probably spend much of your summertime reminding the kids not to leave the doors open, you already know that opening a window when the AC is on is a dumb thing to do (unless you have an evaporative cooler, discussed below). But open windows and doors are just the largest and most obvious avenues for mingling indoor and outdoor temperatures. The smaller avenues, like gaps around light fixtures in your ceiling, are much less obvious and usually ignored, yet these are often the ones that matter the most.
There are a lot of little things that we could all do to save both energy and money. I will expand later on the issue of using energy-specific carbon intensity factors to calculate carbon footprints.

