To have a better idea about the impact that the coming Trump administration will have, it’s time to address the state of the energy transition before the January 20th inauguration. This blog will be data-heavy and next week’s blog will focus on the interconnections between the various impacts. Since the inauguration is a US event, and the actions of the US have a great impact on global activities, the two blogs will emphasize global issues with a strong emphasis on the US. Figures 1 – 3 show the change in average global temperature, the 2022 global distribution of carbon emissions, and the global penetration of solar energy as an alternative energy source. Table 1 and Figure 4 show the recent state of the transition in the US. Table 1 shows the 10 states that were “best” at replacing their electric power grids with non-fossil energy sources and the 10 “worst” in that category. The Inflation Reduction Act (2022) was President Biden’s main legislative achievement in pursuing the energy transition away from fossil fuels. Figure 4 shows the which states benefited the most from the IRA’s creation of green energy jobs.
Figure 5 is a continuation of a previous blog (November 12, 2024) that describes the US governance’s resilience to changes made by new administrations. The Republican victory has been seen as a clear mandate for President-elect Trump. During his campaign, he called to stop the energy transition to non-polluting energy sources, and repeated declarations that climate change is a hoax. These claims contributed to his victory, including full control of Congress. However, even when his tenure is guaranteed for four years (pending on his ability to govern), complete control of the government is limited to two years. By the time of writing this blog (Thanksgiving day), the Republicans’ balance in the House of Representatives is 220-215 in their favor and the balance in the US Senate is 53-47 in the Republicans’ favor. However, in the 2026 congressional elections, the full House of Representatives, and one third of the Senate, will be up for election. Figure 5 shows the US map with the states in which senators will be up for reelection. As the figure shows, red states (ones that elected President-elect Trump) make up the majority. It’s the opposite situation of what we experienced in the previous election.
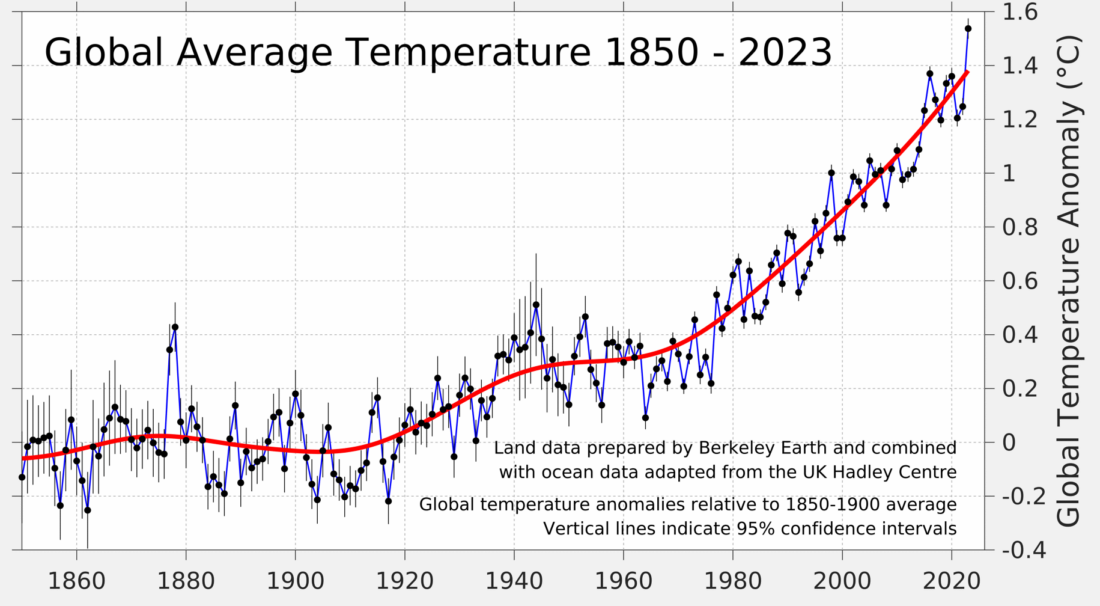
Figure 1 – Global average temperature, 1850-2023 (Source: Berkeley Earth)
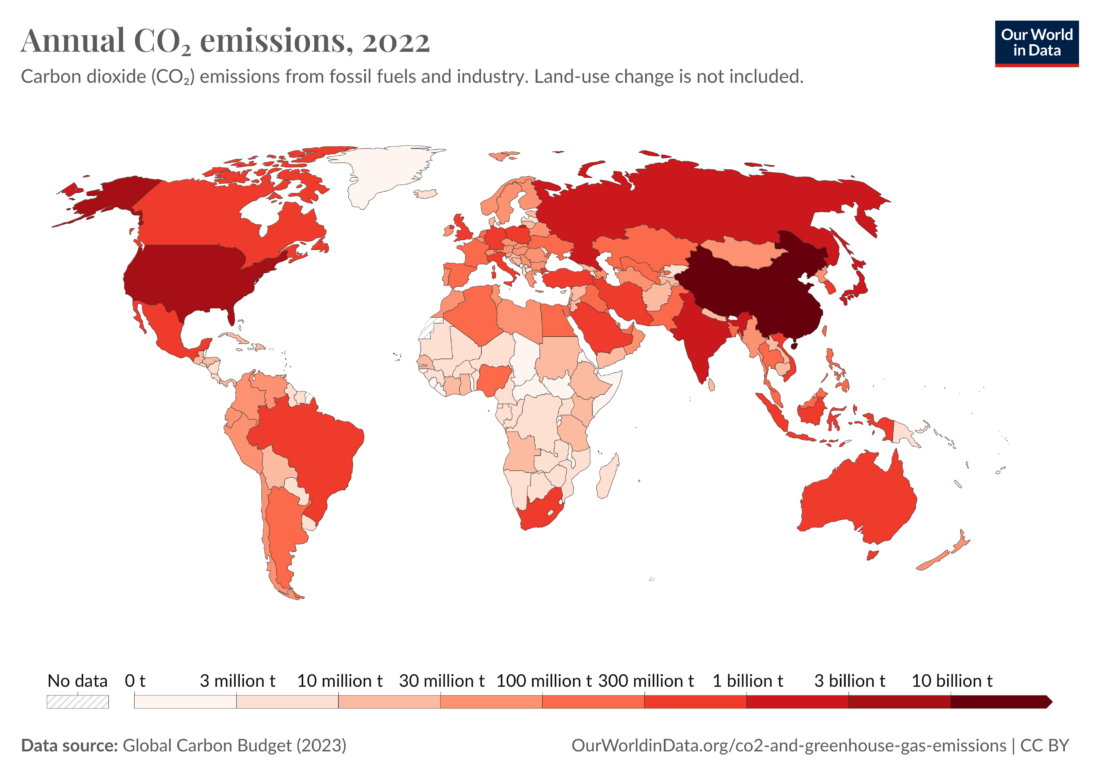 Figure 2 – Map of global emissions (Source: Our World in Data via Wikipedia)
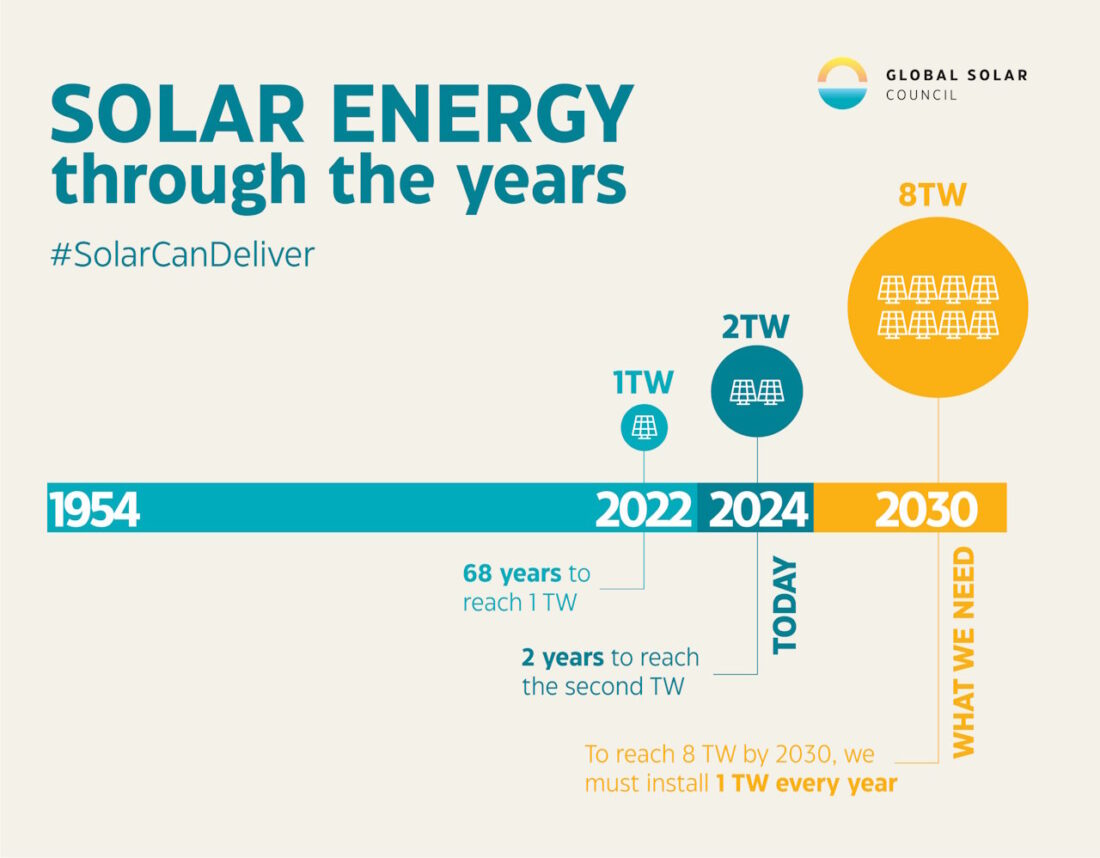 Figure 3 – Solar energy delivery capacity (Source: Renew Economy)
Powering of the electricity grid (2020):
Table 1 – Electricity generation by state, with total power and percentage of non-fossil fuel (Source: Big Think)
|
Best |
||
| % of non-fossil fuel | Total energy (TWh) | |
| Vermont | 99.8 | 2.4 |
| South Dakota | 84.4 | 17.0 |
| Washington | 84.1 | 114.2 |
| Maine | 82.1 | 10.4 |
| Idaho | 79.2 | 19.3 |
| New Hampshire | 77.5 | 16.7 |
| Illinois | 70.5 | 173.6 |
| Oregon | 68.6 | 64.9 |
| Iowa | 66.7 | 59.4 |
| Kansas | 66.1 | 54.3 |
|
Worst |
||
| Delaware | 5.4 | 5.0 |
| Rhode Island | 8.1 | 8.0 |
| Mississippi | 13.4 | 65.8 |
| Kentucky | 14.9 | 63.4 |
| West Virginia | 14.9 | 56.8 |
| Indiana | 16.3 | 89.9 |
| Florida | 17.3 | 249.7 |
| Utah | 19.1 | 37.1 |
| Ohio | 22.5 | 121.1 |
| Hawaii | 22.5 | 9.3 |
The impact of the IRA (Inflation Reduction Act):
Many Americans still have not heard much about the Inflation Reduction Act, which is expected to pour as much as $1.2 trillion into the U.S. economy over the next decade.
“We didn’t lose the election because of the I.R.A., but we also didn’t win because of it and we should have,” said Lena Moffitt, executive director of Evergreen Action, a climate nonprofit.
But rolling back such investments could be a challenge for red states — about 85 percent of the announced investments from the bill have come in Republican districts, according to E2 data from August.
“We’re at the advent of an economic revolution the likes of which we haven’t seen in this country in generations,” said Bob Keefe, executive director of E2. “If it gets rolled back or reduced, it’s not liberals that’ll be hurt, but working people in rural places.”
More than half of 900 clean energy companies surveyed by E2 in October said they would lose business or revenue if the I.R.A. was repealed. Businesses in rural America would suffer the most, according to the survey.
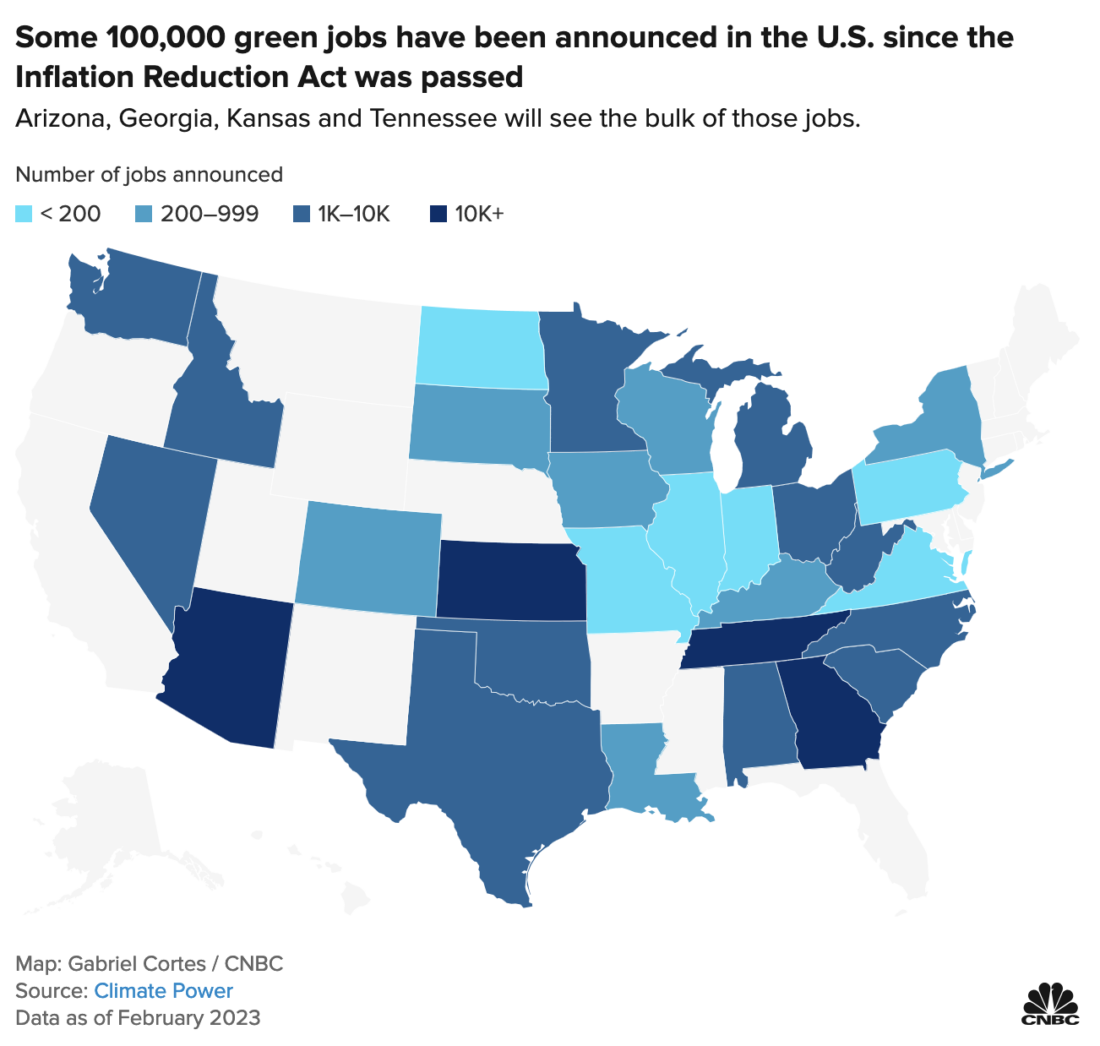
Figure 4 – Green jobs announced after the passage of the Inflation Reduction Act, by state (2022) (Source: CNBC)
Initial verdict: November 2026
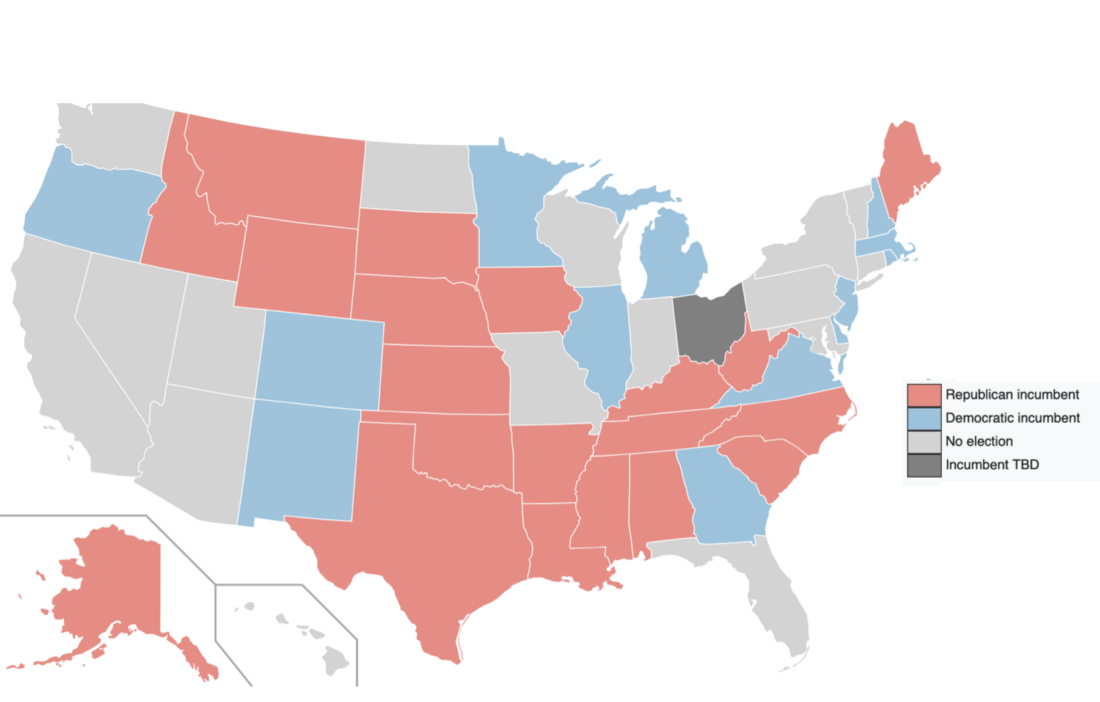
Figure 5 – 2026 US Senate seats up for election (Source: Wikipedia)
The state of the US in terms of the energy transition is now completely different from that which President-elect Trump encountered at the start of his previous term (January 2017). The next two blogs will examine the interconnections of the various impacts, including major campaign issues such as immigration, budget and inflation, and what happens to the international commitments to mitigating global perils that were already made by the US.
