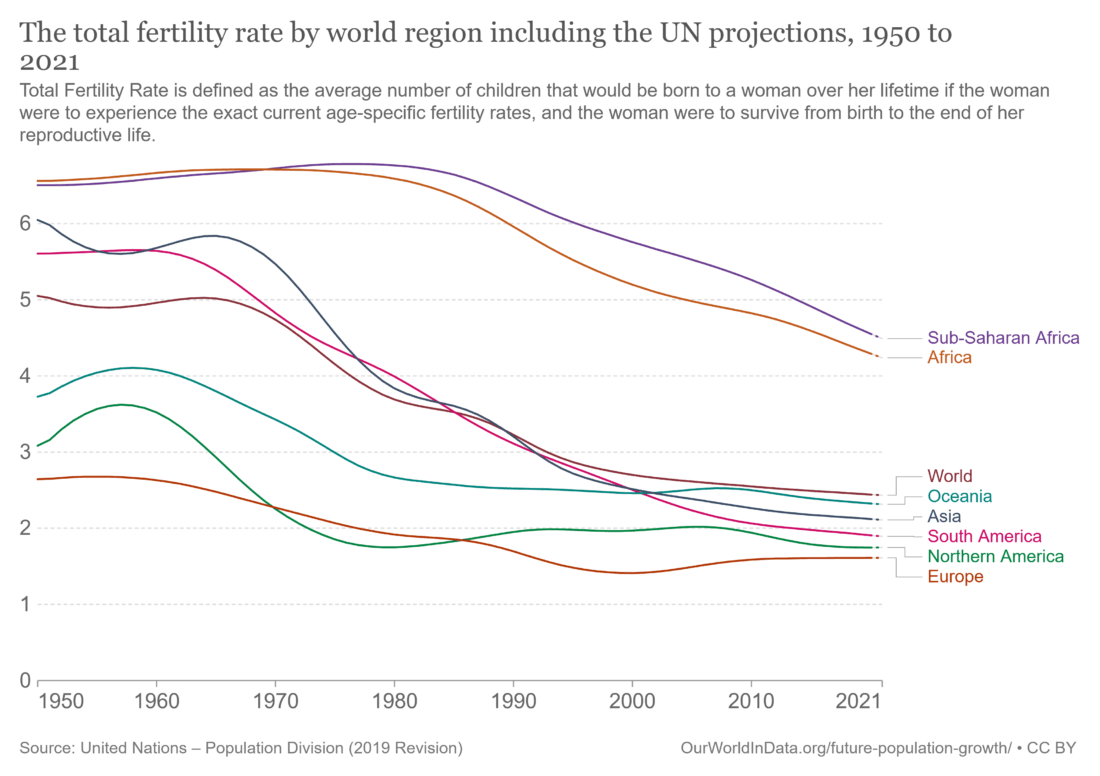
 Figure 1 – Fertility rate by world region, 1950 -2021 (Source)
It’s time to shift to a recent global trend that is less dependent on chaotic governments’ decisions. Among the five main global trends that I have discussed throughout my blog (see June 11, 2024), the one that fits this description best is globally declining fertility. The earliest of my blogs that addresses the issue is “Future Populations” from December 24, 2013. It begins a series that goes through February 25, 2014, including a guest blog by Jim Foreit titled, “How Does Population Decline?” (January 14, 2014). I made a very long comment on Jim’s blog; I’m including two key sentences from it below:
The nature of exponential growth or decline is such that left unchecked they will lead to disasters. As Jim’s blog made clear, we have yet to develop some understanding of how to stabilize populations at any level. The UN fiat of stabilizing the population at replacement rate without suggesting what policies have a chance of accomplishing it, is untenable.
During the 11 years since that blog was posted, the situation hasn’t changed much.
The top figure shows the changes in fertility in the different global regions from 1950 to the present. Over this period, fertility in all global regions has declined. Fertility around the world, except in Africa, is trending around the replacement value of 2.1. Fertility within the rich countries of North America, most of Europe, Australia, and much of Asia is now well below replacement values. (Those of us not familiar with the concept of replacement value are invited to put the two words in the search box for further discussion of the concept.).
A few days ago, we had a visit from two demographer friends. The top graph was an obvious focus of discussion—specifically, the impact of wealth on fertility. The main (in my opinion) point that they raised was the problem of using GDP/Capita as a measure of wealth. To demonstrate the issue, I will focus below on three large countries that together account for 40% of the global population, and include the top representatives of the World Bank’s low-, middle-, and high-income economies: India, China, and the US:
Table 1 (Source: World Population Review)
Median Income 2020 Mean Income 2020 GDP/Capita 2023 (PPP)
US $19,306 $25,332 $82,769
India $1,314 $10,166
China $4,246 $24,569
Table 1 and Figure 2 demonstrate the issue. Figure 2 shows the situation in China, but the inequity of wealth distribution is common throughout the world. Fertility, on the other hand, is an intensive function (not dependent on the number of women used for the calculation) of the country, with equal contributions throughout. Understanding such uneven distribution plays a key role in the now “banned” DEI (diversity, equity and inclusion) initiatives in organizations supported by the federal government.
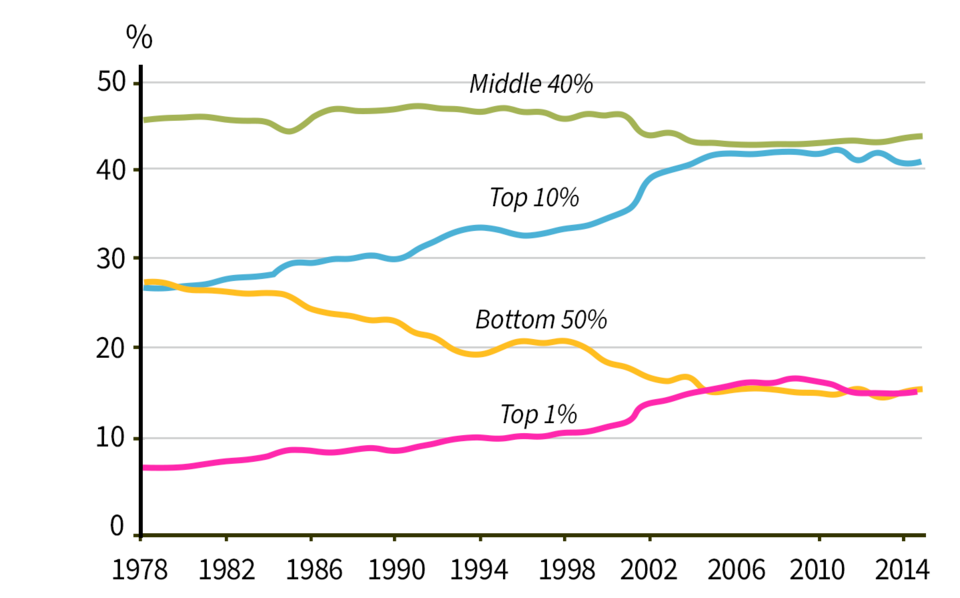 Figure 2 – Wealth distribution in China (Source: Stanford Center on China’s Economy and Institutions)
Now we go to Wikipedia to find out what they have to say on the correlation of fertility with income:
Income and fertility is the association between monetary gain on one hand, and the tendency to produce offspring on the other. There is generally an inverse correlation between income and the total fertility rate within and between nations.[3][4] The higher the degree of education and GDP per capita of a human population, subpopulation or social stratum, the fewer children are born in any developed country.[5] In a 1974 United Nations population conference in Bucharest, Karan Singh, a former minister of population in India, illustrated this trend by stating “Development is the best contraceptive.”[6] In 2015, this thesis was supported by Vogl, T.S., who concluded that increasing the cumulative educational attainment of a generation of parents was by far the most important predictor of the inverse correlation between income and fertility based on a sample of 48 developing countries.[7]
Generally a developed country has a lower fertility rate while a less economically developed country has a higher fertility rate. For example the total fertility rate for Japan, a developed country with per capita GDP of US$32,600 in 2009, was 1.22 children born per woman. But total fertility rate in Ethiopia, with a per capita GDP of $900 in 2009, was 6.17 children born per woman.[8]
Demographic–economic paradox
Herwig Birg has called the inverse relationship between income and fertility a “demo-economic paradox“. Evolutionary biology predicts that more successful individuals (and by analogy countries) should seek to develop optimum conditions for their life and reproduction. However, in the last half of the 20th century it has become clear that the economic success of developed countries is being counterbalanced by a demographic failure, a sub-replacement fertility that may prove destructive for their future economies and societies.[9]
![]()
Figure 3 – Demographic transition – Wikipedia (By Max Roser – Email from author, author of website http://ourworldindata.org/data/population-growth-vital-statistics/world-population-growth, CC BY 4.0, https://commons.wikimedia.org/w/index.php?curid=47036003)
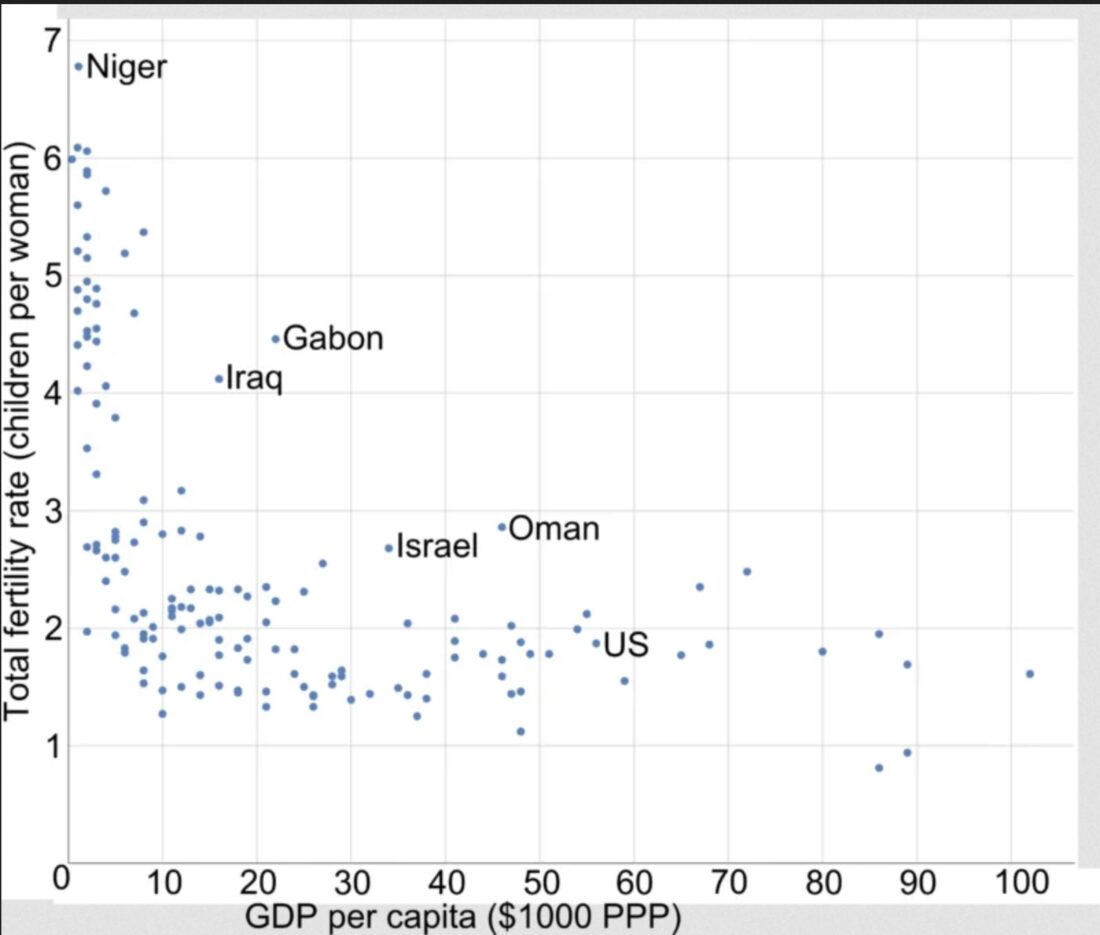
Figure 4 – Global fertility distribution as a function of GDP/capita (PPP) (Source: Medium)
The Wikipedia entry on democratic transitions explains in detail the five stages shown in Figure 3 and their implications on the population pyramids. It shows that in all cases, stages 2, 3, and 4, in which the birth rate considerably increases compared to the death rate, are transitory and eventually most systems return to equilibrium. How long such a transition takes varies among countries and depends on many socio-economic factors. Figure 4 represents 2015 data, showing the random convergences around and below the replacement rate.
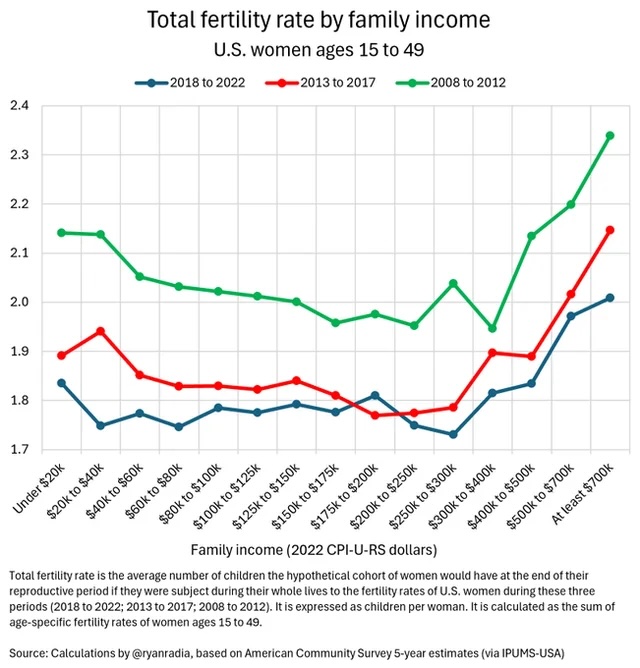 Figure 5 – Total U.S. Fertility Rate by Family Income : r/Natalism
Figure 5 shows another perspective of the fertility dependence on wealth in the US, down to family level.
Figure 5 also shows that the definition of fertility is directly connected to women’s reproductive span. The complexity of the income distribution, down to the family level, is perhaps best illustrated by one individual—the richest individual in the world: Elon Musk. Musk is the dad of 14 kids that he fathered with 4 different women.
Yet, he is taking the position that the global decline in fertility is the most urgent existential threat that the world is facing:
Elon Musk has never been one to shy away from controversial statements. One of his most consistent warnings in recent years has been a warning about the collapse of global birth rates. Recently, he posted a striking map of fertility data from around the world, underscoring what demographers and economists increasingly recognize: the problem facing humanity is not overpopulation but rather underpopulation.
Inadvertently, Musk is putting the burden of solving this existential threat on women. The next blog will focus on the present global efforts to address declining populations.