Mañana is a common expression (derived from Spanish but used much more generally) that translates as tomorrow or in the indeterminate future. It is also the common denominator of my “Three Shades of Deniers” (September 3 blog) that I have previously labeled as “DNNers” (Do Nothing Now: do it, maybe, “tomorrow” or the day after). In the same blog post, I showed one of my test questions, along with my students’ general reaction:
The argument has been made (Dissenting voice in http://climatedebatedaily.com/) that since the projections say that future generations will be much richer than ours, they should pay for the future impacts of climate change. Argue for and against this position.
I don’t ask students to demonstrate any preference, requiring only that they present detailed argument for and against both positions; however, most students show preference against postponing action. The main reason that students provide is that most of the actions possible are time dependent, and the feasibility of remediation quickly decreases the longer we wait.
My student’s response was based mainly on moral grounds: we did it – we should fix it – now!
I would like to add some numbers to further explain and evaluate these options.
I have defined, “Declaration of Victory and Exit Strategy” as follows:
The four figures below illustrate two possible scenarios out of the more than 40 on which the IPCC is reporting. We can declare “victory” and exit the battlefield if toward the end of the century we can derive more than half of our global energy from non-fossil sources, a development that would approximately follow the dynamics of B1 in Figure 4.
In the same blog, I argued that the B1 scenario also requires that the global population stabilize to around 8 billion people as compared to the A2, business as usual, scenario that projects a more than doubling of present global population. Figure 4 in that blog shows very little difference toward mid-century, both in terms of population growth and fraction of energy sources not derived from fossil fuels. Most of the divergence between the two scenarios shows up after 2050.
An interesting consequence of this analysis is that the primary energy per capita is about the same in the two scenarios, with an increase of about 50% to support the projected increase of the standard of living.
The purpose of this blog is to figure out what it will take to reduce the fraction of energy sources that derive their energy from fossil fuels to be below the required 50%.
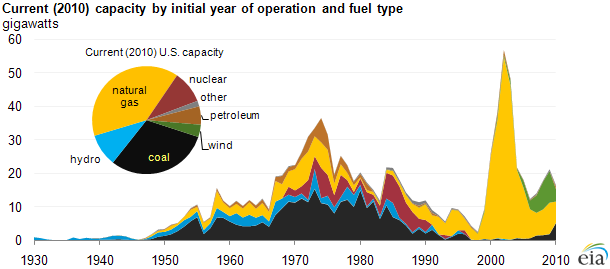
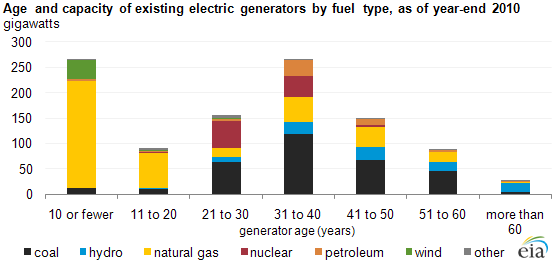
Figures 1 and 2 show the age of power plants in the US in terms of the primary energy sources that drive the conversion (http://www.eia.gov/todayinenergy/detail.cfm?id=1830)
Presently (2009), around 1.5 billion people, around the world, lack access to electricity. This number consists of close to 25% of the world population. Almost all of these people reside in developing countries. Yet, both IPCC scenarios (September 24) predict a much higher average global income toward the end of the century. It is a safe assumption that if the high-income predictions come true, there will be close to universal access to electricity. Currently, developed countries already enjoy such full access. Developed countries spend about half their primary energy consumption on electricity generation (the rest goes mainly to transportation and heating), so electricity is a good proxy for the simulation of future energy consumption. However, if we use electricity as a proxy for primary energy use, we have to take in account that electricity is a secondary energy source with a typical conversion efficiency of 30% from primacy energy sources.
Figures 2 and 3 in the September 24 blog show that the present global need of primary energy is about 16.5 TW (trillion watts); the B1 projects the need by the end of the century at 31TW, while the A2 scenario would require twice as much energy. For simplicity, we will assume that all the energy used goes to generating electricity. The non-fossil fraction of present day generation amounts to 2.4TW, which amounts to around 15% of the primary energy used.
The largest power generating stations that include coal, gas, nuclear and wind are about 1GW (billion watts). That does not mean that we have a single wind turbine that generates billion watts; it refers to the wind farm that can consist of few hundreds turbines connected to the transmission network. The largest photovoltaic farm is 0.1GW with the total global photovoltaic capacity (2011) at 64GW. From Figure 2, a “typical” lifetime of an electric generator can be taken as 50 years, so we can estimate the number of generating stations that will be needed before the end of the century to be about 20,000. If we spread this number uniformly over the remaining 90 years, it will require more than 4 1GW stations per week. To achieve the global objective of the B1 scenario – about half of these stations will need to generate the electricity from non-fossil sources. Such a transition requires all the time that we can provide.
For an estimate of the task, we can have another look at Figure 1. The last 10 years have constituted a very large energy transition to natural gas and renewables. This transition is roughly equivalent to 550 1GW power stations.
Next week we will look closer at this transition.


It was amazing to notice that, despite the fact that this site is ten years old, certain countries still lack power. Ourworldsindata.org reports that “Globally, 940 million people do not have access to power. In recent decades, global access to energy has gradually increased “. However, this is a big difference compared to 1.5 billion years.
Pingback: Limit to Growth – Again? | ClimateChangeFork
Pingback: A Voice from the Inside of a Feeding Transition | ClimateChangeFork