
Happy New Year to everybody! I promised in a previous blog that I would be reading two recently published books to try to find how we could learn from the recent past to make a better future. Last week’s blog was focused on Volker Ullrich’s book titled, Fateful Hours: The Collapse of the Weimar Republic. This blog is focused on Andrew Ross Sorkin’s book, 1929: Inside the Greatest Crash in Wall Street History – and How it Shattered the Nation, shown in Figure 2.
Figure 2 – The cover of the book
The book is written as narrative in two parts; it starts on February 1, 1929, and ends on June 21, 1933 with the jury decision in Charles Mitchell’s trial. Mitchell was one of the main architects of the Wall Street crash, but was found not guilty of the two charges that he faced. The book includes a very extensive 88 pages of Notes and Sources, a 7-page Bibliography, 16 pages of Image Credits and Index, 2 pages of Author Notes, and an 8-page list of “the Cast of Characters and the Companies That They Represent.” The book does not contain any charts, graphs, or tables. This blog tries to correct this absence.
The economic crashes in the US and Germany directly resulted in the election of new leadership in both countries: FDR and Hitler, both shown in Figure 3.

Figure 3
On November 8, 1932, the presidential election took place in the US. Republican incumbent President Hoover was running for a second term against Democratic NY governor, Franklin Delano Roosevelt (FDR). One might think that because of the economic catastrophe that resulted from the crash, FDR would have won easily. He did, but according to the book, his win was not because of a general agreement that he could fix the economy. Rather, it was because of his promise to end Prohibition, which was hated by most Americans. FDR was inaugurated on March 8, 1933.
Figure 4 shows the changes in the Dow Jones Industrial Average from 1920 to 1960. The exponential growth and the crash from the end of October 1929 until 1933 are clearly visible.
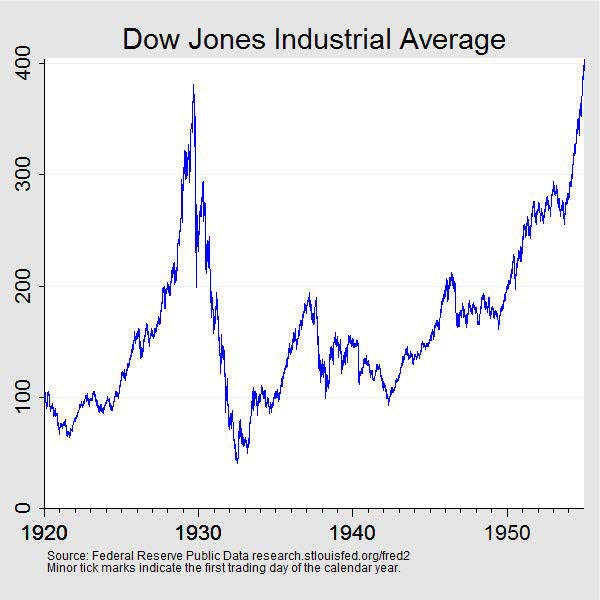 Figure 4 – Stock Market Crash of 1929 | Federal Reserve History
The book makes it clear that a small group of players, most of them major bank officials, fed the exponential growth of the index and uncontrolled margin policy, which directly led to the crash. To understand what that means, it’s helpful to know what margin means in this context:
margin account – a type of brokerage account which allows investors to purchase securities with borrowed funds, requiring a deposit of cash or assets as collateral to cover the risk on such transactions. (Oxford Languages)
The self-feeding that drove the exponential growth and caused the crash worked this way:
- People made investments, borrowing 90% of the money, with the understanding that if the market went below a certain level, they must pay back the loan.
- Many people bought credit in the same way, causing exponential growth.
- Eventually, the market growth started to fall below the agreed level, and people had to return the loans.
- In most cases, the only way to return the loan was to sell stocks, which caused the market to fall further.
- The crash caused major financial losses to many people, leading also to the liquidation of many businesses.
- The liquidation of businesses caused a major increase in unemployment. The country entered a deep recession that acquired the label of Great Depression.
As Figure 5 shows, unemployment in the US reached 25% and returned to the early 1920s rate only at the start of WWII.
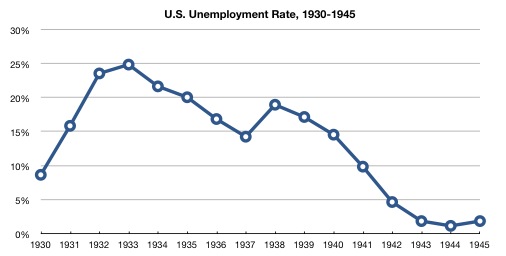 Figure 5 – US unemployment rate, 1930-1945 (Source)
Meanwhile, the Dow Jones of 1929 is different from the one today, both in terms of inflation’s impact on the currency and the overall composition of the index. The AI explanation below lays out the differences.
AI (through Google) – comparing the Dow Jones of 1929 with the present:
-
-
-
- Vastly Different Price Levels: The nominal value of the Dow today (over 48,000 points) is dramatically higher than in 1929 (peaked at ~381 points).
- Regulatory Environment: The 1929 market was characterized by minimal regulation, high margin trading (up to 10x leverage), and slow information flow. Today’s market has significant “guardrails,” including the Securities and Exchange Commission (SEC), stricter margin requirements (requiring at least 50% equity), and circuit breakers to halt trading during rapid declines, making a 1929-style multi-year collapse less likely.
- Federal Reserve Role: In 1929, the Federal Reserve did not actively intervene to stabilize the market. Today, the Fed is expected to and does intervene, using monetary tools to cushion falls and influence the economy.
- Public Participation: In the late 1920s, less than 10% of Americans were invested in the stock market, whereas over 50% are invested today, creating a different market landscape.
- Economic Context: The 1929 crash was a major factor, but not the sole cause, of the multi-year Great Depression, which included massive deflation and unemployment of up to 25%. Modern recessions are severe but do not compare in scale or duration to the Great Depression.
-
-
Table 1 summarizes the impact of inflation on the index.
Table 1 – Inflation-adjusted Dow Jones (AI, through CoPilot)
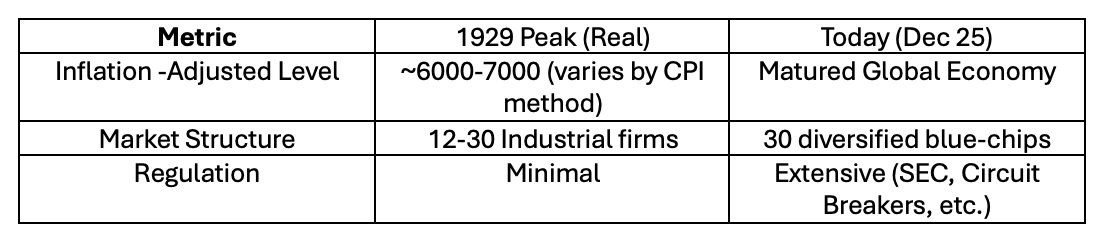
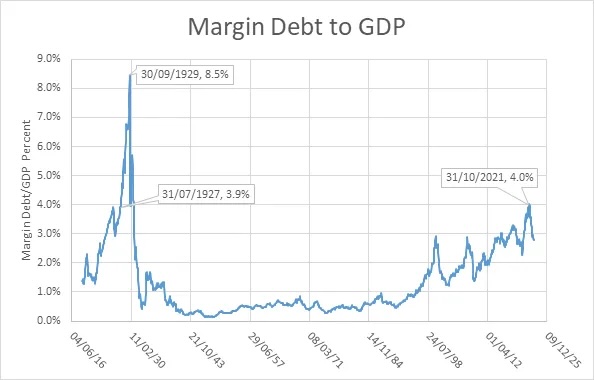
Figure 6 – Margin debt as a percentage of GDP, 1919-2019 (Source: Steve Keen Substack)
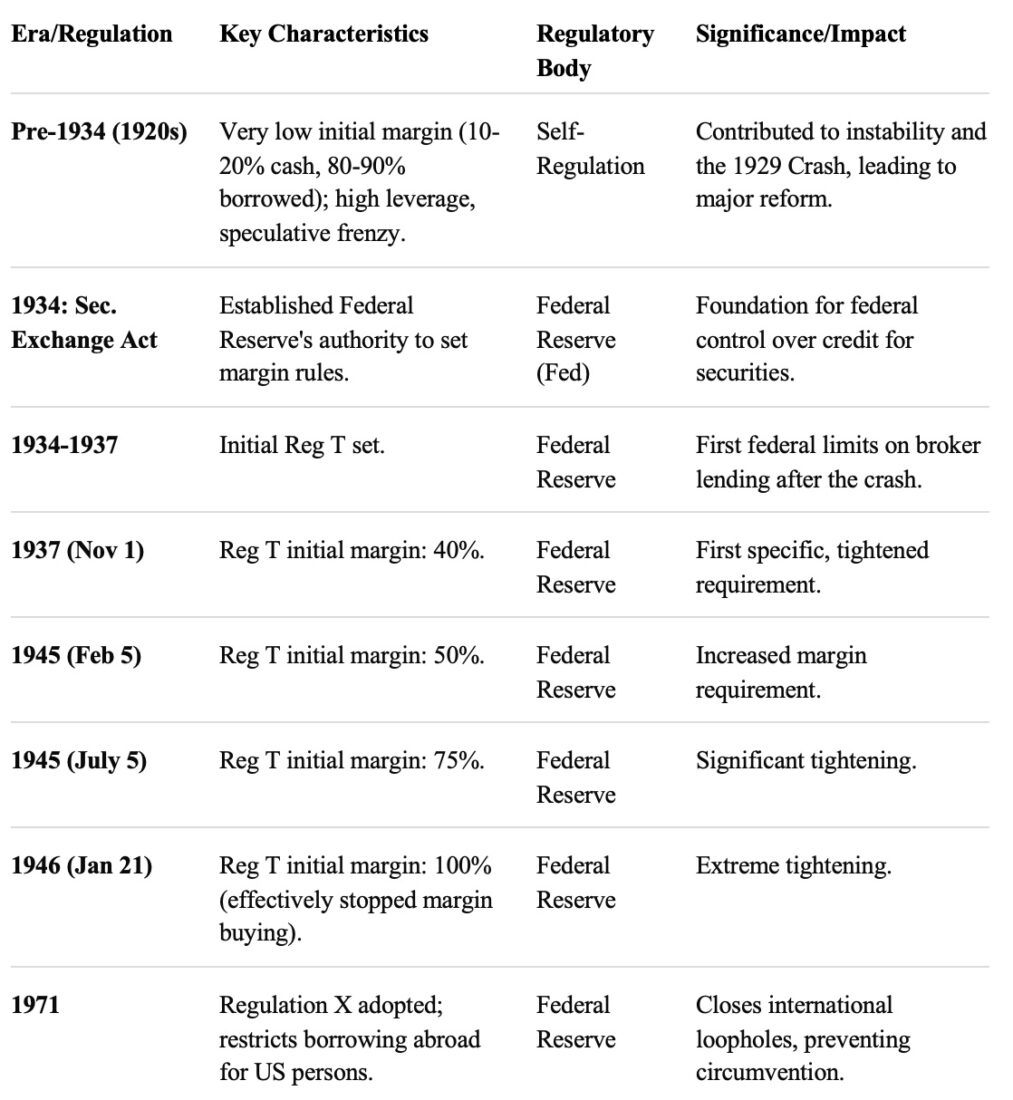
The developments in the margin policy from 1925 until now are summarized in Table 2.
AI (Through Google)
US margin regulations, primarily Federal Reserve Regulations T, U, & X{/nav}, evolved from the loose leverage of the 1920s (80-90% borrowed) to the current 50% standard post-1934 Securities Exchange Act, aiming to curb speculation after the 1929 crash, with varying rates set over time, ultimately settling near 50% for brokers (Reg T) and banks, with rules extended globally (Reg X) to prevent evasion, creating a stable framework for credit in securities.
Here’s a table summarizing key shifts and current rules:
Table 2 – US Margin Requirements: 1925 – Present (Key Milestones)
The dated parts of the book end with FDR’s inauguration and some of the consequences of the crash: The trial of Charles Mitchell, one of the pre-1929 speculation architects, ended with a not guilty verdict, adopting the notion that everybody did what Mitchell did—just on a slightly smaller scale. After FDR’s inauguration, he signed the Glass-Steagall Act, which separated commercial banking from investment banking and introduced insurance for depositors against bankruptcy of the bank. FDR also practically withdrew from the Gold Standard, allowing more flexibility for the national currency.
As was mentioned in last week’s blog, the impact of the crash and the following Great Depression had global consequences that contributed to WWII and what came afterward.