Happy New Year!
My last two blogs raised the issue of a timeline for “absolute” sustainability; one that would give us enough time to move any remnants of the human population to another planet in case we are “successful” in destroying our own. For me, the trivial event of this year’s coincidental timing of Thanksgiving and Hanukkah (an event that was dubbed “Thanksgivukkah”) was the trigger for my thoughts on the matter. In the last blog, I started to illustrate this timeline with projections of global population growth. This is an important starting point because almost every other impact that we can influence strongly depends on population. The objective here, as throughout this blog in general, is to try to provide workable options for present actions.
Instead of just playing with numbers, I thought that it might be useful to put the timeline in terms of visible markers that can serve as incentives for the actions we are advocating. I chose to use the event in which the total global population density equals that of the current most populous mega city (Mumbai – India) to illustrate the dire nature of an exponential population increase. For the opposite occurrence, I described a population decline to 10% of present world values. I selected these markers thinking (perhaps naively) that nobody alive wants to live in a world characterized by either of these two situations, so people might be more open to accepting some corrective actions to avoid such occurrences.
The emphasis on population control to prevent environmental meltdown is a controversial topic with very long history – one that I will probably touch on in some future blogs. The modern version can be traced to Thomas Malthus (1766 – 1834) and to the concept of Malthusian Trap, as summarized in the Wikipedia excerpt below:
It was Thomas Malthus who first made the argument that in “every age and in every state” that population increases are limited by the means of subsistence, and that when the means of subsistence increases, population will also increase, and that the population increase will be limited by “misery and vice.” This pessimistic view on the impossibility of real progress was first made [4] in 1798, ironically, just as the industrial revolution was getting underway.
More recent statistical evidence contradicts these observations. A good opportunity to present the global picture up front came about two years ago, when the global population passed the 7 billion marker (as I have mentioned in previous references to this marker, the global population at the time of my birth was around 2 billion people). To mark this important event (the 7 billion marker, not my birth :)), Science Magazine came out with a full issue that was dedicated to the event (Science, volume 333, 29 July 2011).
Here are some of the global charts that appear in this issue:
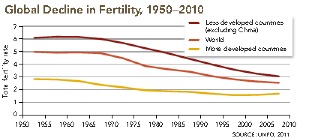

The Malthusian Trap was converted into the Demographic-economic paradox. The fertility rate is defined as the average number of children that would be born to a woman over her lifetime. The first figure above shows that this number has been decreasing over the last 60 years, both for developed and developing countries. The value for developing countries is decreasing from a high value – it now stands at around 3, while that of developed countries is also decreasing – but from a considerably lower value – and now stands at below 2. The number 2 is an important marker; in principle, it represents a replacement value for the two parents. Any number above two will drive the population higher and any number below two will lower the population. In real life many women will never reach childbearing age (one of the main reasons for that is infant mortality). The replacement value in developed countries is now estimated to be 2.1 and in developing countries it is estimated at 2.5. So, presently, the population growth in developed countries is negative while the population of developing countries is growing. The balance is shown in the second figure, which illustrates a population that is still growing, but at a considerably slower rate.
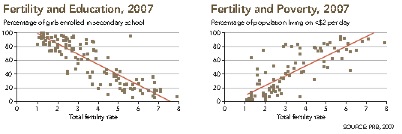
The last two figures show some of the most important driving forces that are causing the fertility rate to fall: decrease in poverty and increase in education, especially among woman. The correlation is so strong that Wikipedia (in the Demographic-economic paradox site– cited above) quotes Karan Singh, a former minister of population in India, as having said, “Development is the best contraceptive.”
In the previous blog, I quoted a United Nations report that projects the long-term population increase will stabilize around the year 2050 to replacement fertility and stay as such over the long term with the population between 8 – 9 billion people. The question that I did not find an answer to is how to reach such stability.
There are many professional experts that specialize in demographics (the study of statistics of population). I am not one of them. I have contacted a friend that qualifies and I hope that he will contribute a guest blog that addresses the issue.
Wow, marvelous blog layout! How lengthy have you been running a blog for? you make running a blog glance easy. The entire glance of your web site is great, let alone the content material!