Lately I have been looking at Canada’s progress in the stuttering energy transition, however the United States might be a better focal point for assessing the impact that bottom-up policies (from smaller regions below the level of sovereign states) can have on the global energy transition to a more sustainable mix of sources. The IPAT identity might be a good place to start with such scenario building. Searching CCF for the term IPAT yields nearly a quarter of the blogs; clearly I think it is incredibly important. I discussed it in some detail in the November 26, 2012 post:
There is a useful identity that correlates the environmental impacts (greenhouse gases, in Governor’s Romney statement) with the other indicators. The equation is known as the IPAT equation (or I=PAT), which stands for Impact Population Affluence Technology. The equation was proposed independently by two research teams; one consists of Paul R. Ehrlich and John Holdren (now President Obama’s Science Adviser), while the other is led by Barry Commoner (P.R. Ehrlich and J.P. Holdren; Bulletin of Atmospheric Science 28:16 (1972). B. Commoner; Bulletin of Atmospheric Science 28:42 (1972).)
The identity takes the following form:
Impact = Population x Affluence x Technology
Almost all of the future scenarios for climate change make separate estimates of the indicators in this equation. The difference factor of 15 in GDP/Person (measure of affluence), between the average Chinese and average American makes it clear that the Chinese and the rest of the developing world will do everything they can to try to “even the score” with the developed world. The global challenge is how to do this while at the same time minimizing the environmental impact.
Up until now, I have mainly confined the discussion about IPAT and scenario building to the efforts and actions of sovereign states, but I’d like to extend that to sub-sovereign levels – applying it not only to individual US states, but even further down to major global cities. I did a similar exercise a few years ago with two of my students (See “Intensive and Extensive Parametrization of Energy Use and Income in US States and in Global Urban Environments” by Yevgeniy Ostrovskiy, Michael Cheng and Micha Tomkiewicz; The International Journal of Climate Change: Impacts and Responses, Volume 4, Issue 4, pp.97-109.)
There are important differences in the identity between sovereign states and sub-sovereign states. One can get an idea of some of these differences by reading the original publication. Generally, the identity holds true for both levels of governments. But does my analysis comparing British Columbia and Alberta following the former’s implementation of a carbon tax hold water when we move out of Canada?
In the last few blogs we saw one important sign that the carbon tax was effective in moving British Columbia away from fossil fuels to alternative energy sources: relative to the rest of Canada, BC reduced its use of fossil fuels in its energy mix. This is an important indicator, but is it the only one that is significant?
To explore that, we need to expand the Technology term in the IPAT identity:
Technology = (Energy/Affluence) x (Fossil/Energy) x (Carbon Dioxide/Fossil)
The first term (Energy/Affluence) is the energy intensity, or how much energy we need to produce a unit of affluence – as measured by GDP, national, or state income.
The second term (Fossil/Energy) measures the fraction of the energy needs that are met by fossil fuels.
The third term (Carbon Dioxide/Fossil) measures the type of fossil fuel being used. Coal emits more than twice the amount of carbon dioxide as natural gas does to produce the same amount of energy.
For British Columbia we saw that after the carbon tax, the fraction of energy sourced from fossil fuels was reduced, compared to the rest of Canada. However, we did not see direct impacts on either the amount of energy used to produce a given amount of affluence or the carbon emissions levels.
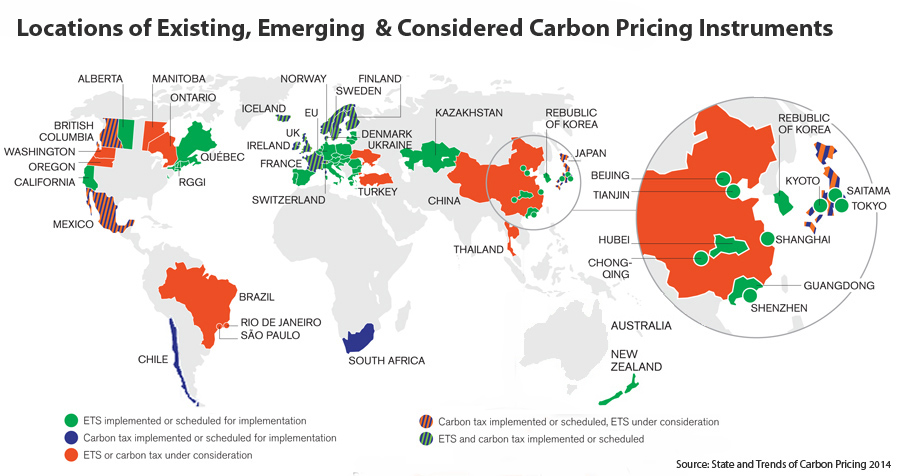
Using the same carbon pricing global map from previous blogs (May 5, 2015), let’s move our attention back to the United States. California and the RGGI (Regional Greenhouse Gas Initiative), which includes the East Coast states of Connecticut, Maine, Maryland, Massachusetts, New Hampshire, Rhode Island and Vermont, have been notably active in creating greenhouse gas regulations. Texas and Hawaii are not among this list, but the two states have also featured prominently in recent news about the issue.
This brings me back to last year’s TV series “Years of Living Dangerously” (April 22, 2014 blog ). Don Cheadle, who narrated the first episode, showed the different local responses to the droughts in Texas and California. In California, the prevailing opinion seemed to be that climate change was an important contributing cause, while in Texas many believed that the droughts were an act of God. Cheadle went to Texas to interview Katherine Hayhoe, an atmospheric scientist and devout evangelist. She joined the evangelists in their prayers but also explained to them that there is no contradiction between believing in God and believing in science (The Pope is now strongly presenting the same view). Through her efforts, much of the audience started to believe that not only does anthropogenic climate change have something to do with the droughts, but there are steps we (and they) can take to mitigate it. That said, just as there is much more to Texas than religious beliefs, there is much more to climate change than being an important cause of regional droughts.
One anecdotal example from Texas reflects the complexity of the transition and some of the driving forces that are completely absent from the IPAT identity – the events taking place in Georgetown, a small town in Texas (50,000 people):
In many Texas cities the electricity market is deregulated, meaning that customers choose from a dizzying variety of providers and plans. In Houston, for example, there are more than 70 plans that offer energy from entirely renewable sources.
That makes it easy to switch, so in a dynamic marketplace, providers tend to focus on the immediate future. This discourages the creation of renewable energy facilities, which require long-term investment to be viable. But in Georgetown, the city utility company has a monopoly.
When its staff examined their options last year, they discovered something that seemed remarkable, especially in Texas: renewable energy was cheaper than non-renewable. And so last month city officials finalised a deal with SunEdison, a giant multinational solar energy company. It means that by January 2017, all electricity within the city’s service area will come from wind and solar power.
In 2014, the city signed a 20-year agreement with EDF for wind power from a forthcoming project near Amarillo. Taking the renewable elements up to 100%, SunEdison will build plants in west Texas that will provide Georgetown with 150 megawatts of solar power in a deal running from 2016 or 2017 to 2041. With consistent and reliable production the goal, the combination takes into account that wind farms generate most of their energy in the evenings, after the sun has set.
Even on a sub-sovereign level the world is far from being homogeneous and many localities are now experimenting with major changes. Interestingly, these experiments didn’t end in 2014 when the price of oil dropped globally by more than 50%. In fact, prices don’t seem to be the dominant driving force behind the transition; we will continue to explore some of other dominant forces as they take shape during this important period, but suffice it to say that some of these smaller trials could well become great models for the rest of the world.
This is interesting, but I disagree with the formula! I don;t think Affluence is necessarily a factor in pollution or impact. The reason I say this is that in the last decade or 2 I have traveled to some cities in a Central American country *which shall be nameless), The traffic was horrendous! Cars all over the place! Buses and trucks billowed tons of black smoke from their exhaust systems! They sounded like they didn’t even have mufflers! Yet this was not considered a n affluent country! Actually it is thought of as a third world country! The tons of thick black smoke put into the air could not care less if it was from an affluent country or a poor country. So th formula needs revising, and my suggestion is to omit the “Affluence” parameter!