The last few blogs have been dedicated to COP27 and its central achievement of clinching a unanimous decision to create a fiscal mechanism for the rich countries to transfer resources to the developing countries for adaptation to climate change. It was necessary for the rich countries to agree because without such help the developing countries refuse to cooperate with mitigation efforts and the situation becomes worse for everybody. The mechanism for how this financial transfer will actually operate is under discussion, to be ready a year from now and finalized at COP28.
In the last few blogs, I also tried to raise two important questions: (1) Suppose the mechanism becomes operational and the developing countries can get the money for adaptation; what kind of projects are those countries interested in pursuing (see last week’s blog)? And (2) While we are focusing mostly on adaptation in developing countries, adaptations are specific to localities; given that many developed countries also suffer from a sharp disparity in financial resources, what is to be done with underdeveloped areas in developed countries? This blog tries to address the second question with a focus on the US.
My discussion starts with three vulnerability findings in a study reported by Matt Burdett, presented in the following three figures:
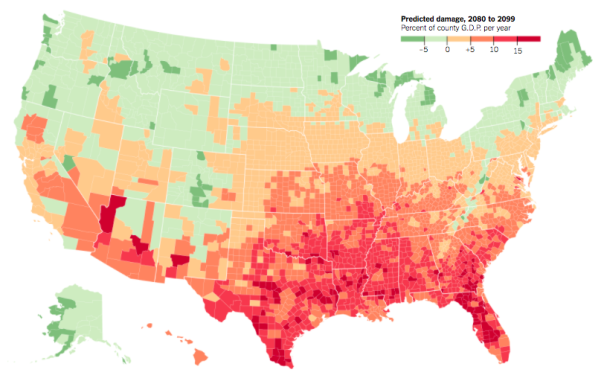
Figure 1 – Variation of the economic cost of climate change: predicted damage, 2080 – 2099
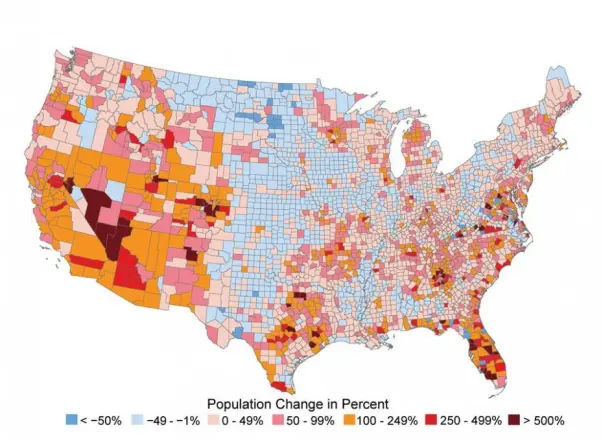
Figure 2 – Percentage change in population 1970 – 2008
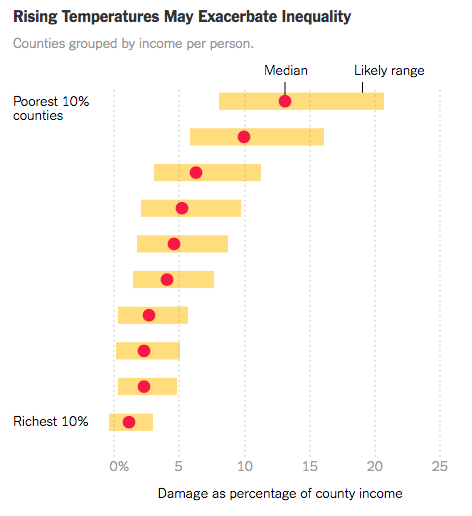
Figure 3 – Rising temperature damage as a percentage of county income in the US
I discussed the irrationality of people’s mass movement to the most vulnerable locations in the US in an earlier blog (November 1, 2022), with Arizona as an example. Figure 1 shows the most vulnerable areas of the country and Figure 2 shows the migration trends. Figure 3 shows the effects of income disparity within the US.
Georgetown Climate Center’s State Adaptation Progress Trackerdiscusses which states are already implementing adaptation policies and which ones are “considering” such policies:
States and communities around the country have begun to prepare for the climate changes that are already underway. This planning process typically results in a document called an adaptation plan.
Below is a map that highlights the status of state adaptation efforts. Click on a state to view a summary of its progress to date and to access its full profile page. State profile pages include a detailed breakdown of each state’s adaptation work and links to local adaptation plans and resources. Please move the map to view Alaska and Hawaii.
The conflict of whether to pay for damage or pay for adaptation is discussed in howmuch.net based on work discussed in Science magazine. A summary of the Science magazine findings is given below:
Estimates of climate change damage are central to the design of climate policies. Here, we develop a flexible architecture for computing damages that integrates climate science, econometric analyses, and process models. We use this approach to construct spatially explicit, probabilistic, and empirically derived estimates of economic damage in the United States from climate change. The combined value of market and nonmarket damage across analyzed sectors—agriculture, crime, coastal storms, energy, human mortality, and labor—increases quadratically in global mean temperature, costing roughly 1.2% of gross domestic product per +1°C on average. Importantly, risk is distributed unequally across locations, generating a large transfer of value northward and westward that increases economic inequality. By the late 21st century, the poorest third of counties are projected to experience damages between 2 and 20% of county income (90% chance) under business-as-usual emissions (Representative Concentration Pathway 8.5).
A special IPCC report, “Managing the Risks of Extreme Events and Disasters to Advance Climate Change Adaptation,” which enumerates the management of extreme events and disasters adaptation to climate change was published a few years ago.
An estimate of how much such efforts can cost the US can be found in this Scientific American piece.
Two recent examples of such payments can be found below:
U. S. to Pay Millions to Move Tribes Threatened by Climate Change
WASHINGTON — The Biden administration will give three Native tribes $75 million to move away from coastal areas or rivers, one of the nation’s largest efforts to date to relocate communities that are facing an urgent threat from climate change.
The three communities — two in Alaska, and one in Washington State — will each get $25 million to move their key buildings onto higher ground and away from rising waters, with the expectation that homes will follow. The federal government will give eight more tribes $5 million each to plan for relocation.
Climate-Proof Towns Are Popping Up Across the U.S. But Not Everyone Can Afford To Live There
In the aftermath of Hurricane Ian, which hit Florida’s southwest coast on Sept. 28 as a Category 4 storm, all eyes turned to one town. Just a few miles from places like Fort Myers, Port Charlotte, and Arcadia, where buildings were torn open or flooded, Babcock Ranch emerged virtually unscathed. Its 4,600 residents never lost power or internet access during the storm. And they were able to offer up their homes and school as shelter for less fortunate communities nearby.
The reason for Babcock Ranch’s unusual resilience? Planning. The town, which sold its first home in 2018, is part of a growing group of new master-planned communities in the U.S. designed with the increasingly severe impacts of the climate crisis in mind. Developers chose the location for Babcock Ranch, 20 miles inland and 30 feet above sea level, to escape storm surges. They buried power lines underground to shield them from wind. They designed drainage systems to complement the natural flow of rainwater over the landscape, with native vegetation soaking up water along roadways. And, they installed a large solar farm and battery infrastructure to keep the lights on even when the regional grid is struggling.
None of these enumerations include the expenses (social and monetary), of individual immigration (internal and external) of people seeking safety as environmental refugees (see April 3, 2018 blog).
Meanwhile, the World Bank provides estimates that include concrete numbers about the cost of extreme weather events globally, including values of damage in dollars:
Disasters, whether from natural hazards or man-made, cost lives and livelihoods. The immediate spending needed for response and reconstruction is compounded by a weakened economy, damaged infrastructure, destroyed businesses, reduced tax revenues and a rise in poverty levels.
- According to the latest data from insurer Munich Re, losses from natural catastrophes in 2020 rose to $210 billion globally, from $166 billion in 2019.
- Of all of deaths from weather, climate, and water hazards, 91% occurred in developing economies, according to the United Nations country classification from 1970 through 2019. The proportion remains similar for the World Bank country classification, according to which 82% of deaths occurred in low and lower-middle-income countries.
- Since 1980, more than 2.4 million people and over $3.7 trillion have been lost to disasters caused by natural hazards globally, with total damages increasing by more than 800%, from $18 billion a year in the 1980s to $167 billion a year in the last decade.
- Funded by the Global Facility for Disaster Reduction and Recovery (GFDRR),a World Bank report Shock Waves (2016) states that almost 75% of the losses are attributable to extreme weather events. As climate change threatens to push an additional 100 million people into extreme poverty by 2030, another GFDRR-funded report Unbreakable (2017) shows that natural hazards have had large and long-lasting impacts on poverty.
I’ve mentioned before that implementation of the new mechanism agreed upon in COP27 to help developing countries adapt to the damage that is now growing because of the accelerating climate change, will have to wait for COP28 after a year-long discussion. Now is a trying time for such discussions.
As a recent NYT article emphasizes, many developing countries are already heavily in debt and in danger of catastrophic default, as summarized below:
WASHINGTON — Developing nations are facing a catastrophic debt crisis in the coming months as rapid inflation, slowing growth, rising interest rates and a strengthening dollar coalesce into a perfect storm that could set off a wave of messy defaults and inflict economic pain on the world’s most vulnerable people.
Poor countries owe, by some calculations, as much as $200 billion to wealthy nations, multilateral development banks and private creditors. Rising interest rates have increased the value of the dollar, making it harder for foreign borrowers with debt denominated in U.S. currency to repay their loans.
It will be difficult to agree to separate the new transfer of money proposals from the urgent need to restructure the present financial obligations. Stay tuned.
I think that more developed countries in this case are going to be much more easier to adapt to immigration and increasing birth rates compared to developing countries. This is because of the higher costs and available money, along with better adaptability.