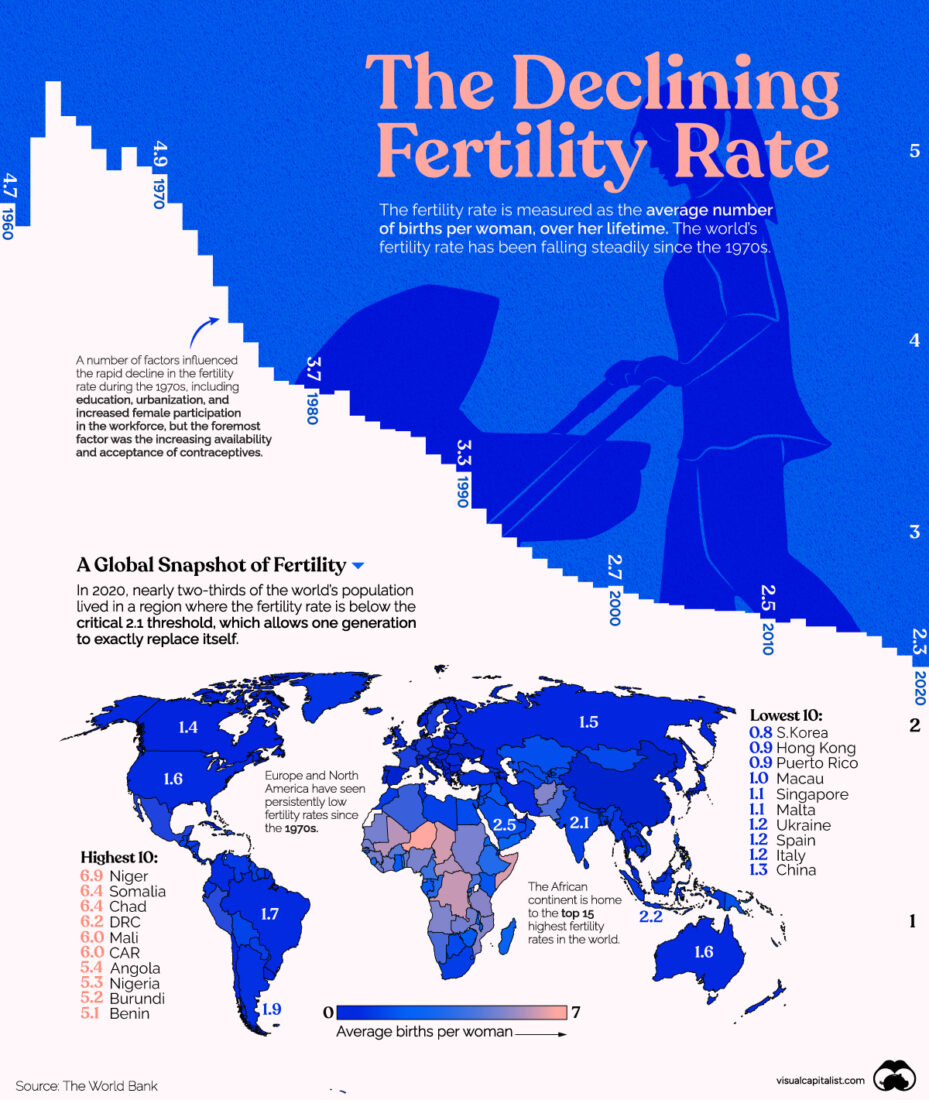
 Figure 1 – Declining fertility rate (Source: Visual Capitalist)
This blog starts with a large infographic that was recently compiled by my favorite site, Visual Capitalist, based on recent data from the Word Bank. For more examples of my use of their work, just use the search box. This blog is a continuation of previous blogs that focused on the global population transition (see January 11, 2022). It is also a follow-up on my blog from a few weeks ago (January 16, 2024) where I started describing the present global dynamics that have put global immigration patterns at the center of global concerns that set government priorities.
This blog focuses on data. Future blogs will try to draw some important conclusions from the data.
I am starting with citations from two recent articles that describe the population transition in China and some of its consequences. China, until very recently, was the most populated country, with a GDP just second to the US, and whose GDP growth was greatly outpacing that of fully developed countries. Things are starting to change now.
I am starting with a NYT article:
China’s population has begun to decline, a demographic turning point for the country that has global implications. Experts had long anticipated this moment, but it arrived in 2022 several years earlier than expected, prompting hand-wringing among economists over the long-term impacts given the country’s immense economic heft and its role as the world’s manufacturer.
With 850,000 fewer births than deaths last year, at least according to the country’s official report, China joined an expanding set of nations with shrinking populations caused by years of falling fertility and often little or even negative net migration, a group that includes Italy, Greece and Russia, along with swaths of Eastern and Southern Europe and several Asian nations like South Korea and Japan.
The next article describes some of the reactions in China to the changing reality:
In his 2024 New Year message, Xi Jinping stated that the post-Covid Chinese economy had “sustained the momentum of recovery” and that all Chinese people, including in Taiwan, should share in the “glory of the rejuvenation of the Chinese nation”.
Both these leaden phrases are fantasy. However confident Xi may feel in his autocratic grip on the Chinese Communist Party (CCP), he seemingly lacks both the vision and means to reverse China’s slide into a classic middle-income trap. The CCP’s expected economic bounce-back after the pandemic has not materialised; IMF forecasts are bleak. For 60 years, the Chinese population grew; we now learn it is beginning to contract. The death rate last year was the highest since 1974, when China was wracked by the chaos of Mao’s Cultural Revolution. But even more alarming, the 2023 birth rate fell by 5.7%, the lowest recorded in CCP history.
Figure 2 describes the present situation of global immigration. According to the data in Figure 2, 280 million people globally live as immigrants. This number amounts to approximately 3.5% of the global population (2020). In the US, the number exceeds 50M. The source of the data is World Population Review, which specifies: “Immigration is defined as the international movement of people from their country of origin (either where they were born or have citizenship) to a different destination country” (I am one of them). There is no mention in these sources whether there is any distinction between legal and illegal immigrants.
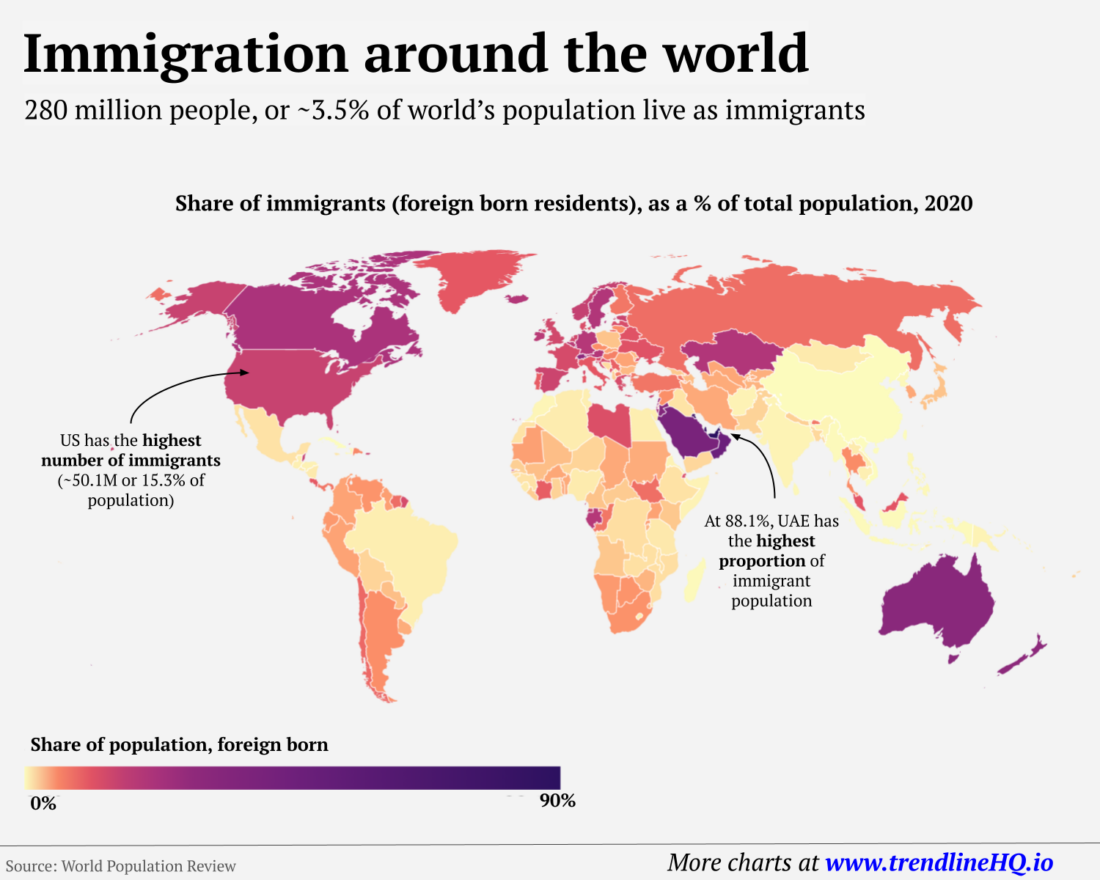 Figure 2 – Worldwide immigration (Source: World Population Review via Reddit)
The heart of this blog is shown in Table 1, below. The sum of the populations of the 20 countries amounts to more than 50% of the total global population. The fertility rates for most of these countries were taken from the Visual Capitalist infographic, which took its data from the World Population Review. The fertility rates of the rest of the countries in the table came from Googling the most recent data. All the data is post-2020 but I made no effort to keep the data to the same year.
Table 1 – Recent fertility rates and population growth of 20 countries with populations greater than 25 million and fertility rates at or below replacement.
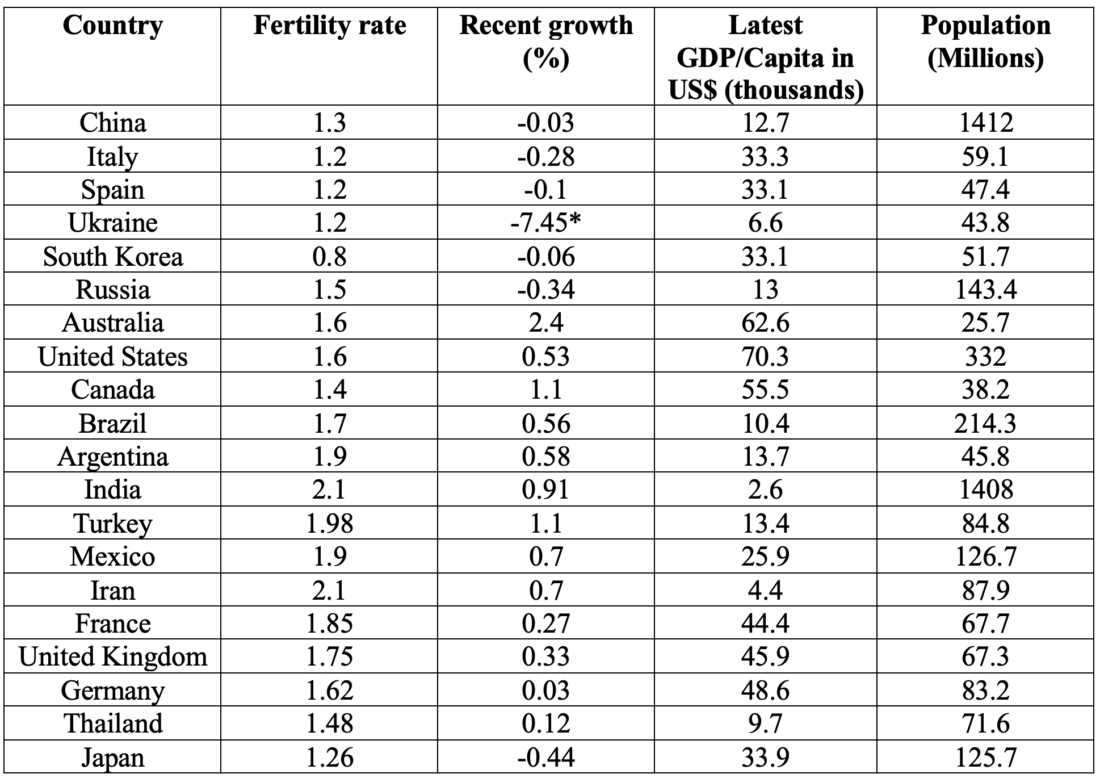
*The population decline in Ukraine is mostly the result of the Russian invasion that started on February 24, 2022. More recently, some of these refugees have started returning.
As can be seen, the trend of at- or below-replacement fertility extends well beyond the developed countries. In many of the countries shown in the table, the population growth is already negative. In many others, the positive growth is largely a result of immigration and the phase difference between below-replacement fertility and overall population decline.
Some consequences of these trends will be explored in future blogs.