Energy is known as the physical quantity with the largest number of equivalent units. The main reason is historical. Table 2, from last week’s blog, included two issues that I promised to address, so I have carried the data over to this post. Table 1 in this blog is nearly identical to the original, with the exception that the column that showed each country’s position on the environmental Kuznets curve has been replaced by two columns showing their degree of electrification and where they fall on the World Bank’s classifications within the Global Income.
Figure 1 shows that—despite present US policies summarized by the “Drill Baby, Drill” slogan—globally, we are almost through with the energy transition away from fossil fuels. It shows that in 2024 (just before Trump’s second inauguration), 75% of electricity demand was supplied by non-fossil sources, with the largest share coming from direct solar and wind (also part of solar).
I raised two main issues in last week’s blog. First, in spite of the large differences in economic activity—as measured through changes in GDP/capita—the differences in carbon intensity are much smaller. Second, in the listing of pre-electrification GDPs, sustainable creation was not specifically mentioned as relevant, which I believe is an oversight.
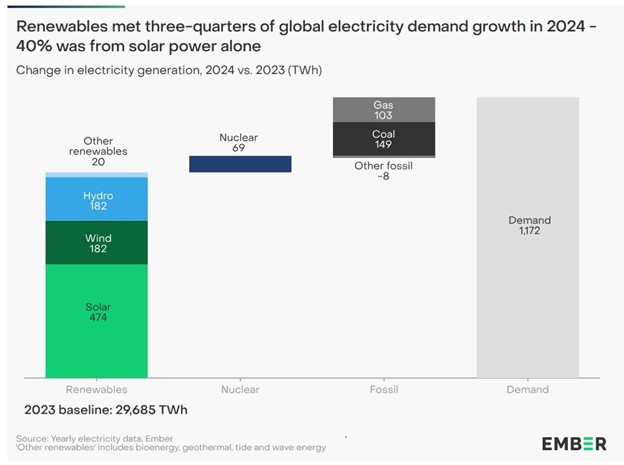
Figure 1 – Electricity generation by power source (Source: Ember)
Table 1 – Compiled data for carbon intensity and estimated alignments with population, GDP/capita, and percentage of population with access to electricity
| Country | Carbon Intensity in kg/$ (≈2024) | Population in Millions (2024) | Latest GDP/Capita in US$ (in thousands) | Percentage of population with access to electricity (2020) | Part of Global Economic Income |
| China | 0.39 | 1,425 | 12.7 | 100 | UMI |
| Russia | 0.33 | 144 | 13 | 100 | UMI |
| Indonesia | 0.2 | 277 | 4.8 | 97.9 | UMI |
| India | 0.22 | 1,428 | 2.4 | 100 | LMI |
| US | 0.18 | 339 | 76.3 | 100 | HI |
| Pakistan | 0.15 | 240 | 1.6 | 94.5 | LMI |
| Brazil | 0.12 | 216 | 9.0 | 100 | UMI |
| Nigeria | 0.1 | 224 | 2.2 | 55.4 | LMI |
| Bangladesh | 0.09 | 173 | 2.7 | 96.2 | LMI |
| Ethiopia | <0.05 | 128 | 0.9 | 51.1 | LI |
As in last week’s blog, the countries in this table account for more than 50% (55%) of the world population. Most of them (8) belong to the Lower and Upper-Middle Income brackets (4 to each), and one each to the High Income and Low Income categories.
Table 2 – Global Economic Income distribution, including each level’s share of the world’s population and carbon emissions (Source: OurWorldInData, 2024)
| Global income category | Share of carbon emissions (%) | Share of the global population (%) |
| High Income | 34.4 | 15.4 |
| Low Income | 0.6 | 8.8 |
| Upper-Middle Income | 45.8 | 32.2 |
| Lower-Middle Income | 16.8 | 43.1 |
Table 2 shows that the contribution of pre-electrification to carbon emissions can be approximately neglected. Only two countries in Table 2 qualify: Ethiopia and Nigeria. Both are in Africa, and, as shown in a previous blog (April 8, 2026), they are quickly joining the electrification trend. The convergence of differences between rich and poor countries in carbon intensities is a different issue, directly related to the nature of carbon intensity as an intensive property.
An intensive property or intensive quantity is one whose magnitude (extent) is independent of the size of the system. An extensive property or extensive quantity is one whose magnitude is additive for subsystems. Carbon emissions and GDP are extensive properties that change with the population of a state. Carbon intensity is the ratio of carbon emissions to the population; thus, it is the ratio of two extensive properties for the same system size. Therefore, the ratio is an intensive property, independent of the population that acts here as the size of the system. However, comparing two extensive properties to different system sizes will not produce an intensive property.
In our case, the simplest way to try to examine this situation is by focusing on two countries in Table 1: the US and India. The GDP/capita is about the same (22% measured with respect to the smallest number: the US). The difference in GDP/capita is huge (~ 3000% again in terms of the smallest: India).
Let’s find the scaling law by abbreviating the terms, with India as country A and the US as country B: Carbon emissions of India = CEA; Carbon emissions of the US = CEB; Population of India = PA; Population of the US = PB; Carbon intensity of India = CIA; Carbon intensity of the US = CIB. The ratio between the populations is PA = KPB. The definition of carbon intensity is: Carbon emissions/ GDP. We are looking to divide CIA by CIB, the Carbon intensity of India by that of the US:
CIA = (CEA/PA) = (CEA/KPB):
So, CIA/CIB = (CEA/PA)/(CEB/PB) = (1/K)x(CEA/CEB) and the carbon intensity scales down with the population ratio K. in our example, that comes to 1428/ 338 = 4.2
One can see similar “equalization” numbers in Table 3, which was copied from a previous blog (March 25, 2026), that deals with changes of energy and GDP with time. Global primary energy use has grown by a factor of 630/238, or 2.6 from 1973 to 2025.
Table 3 – Comparison of global socioeconomic indicators in 1973 and 2025 2.8*1011kWh/1 Exajoules
| Socioeconomic Indicators | 1973 | 2025 |
| Population (in billions) | 4 | 8.2 |
| Primary energy use (exajoules) | 238 | 630 |
| Primary energy use per capita (kWh/capita) | 22,000 | 26,000 |
| GDP (nominal US$ in trillions) | 4 | 112 |
| GDP (constant US$ in trillions) | 4 | 16 |
Meanwhile, the same energy per capita only grew by a factor of 26,000/22,000, or 1.18. The reasons for the convergence here are different than those of the carbon intensity convergence. It directly involves a climb in the environmental Kuznets curve that was discussed in last week’s blog. The almost constant global primary energy use per capita over two generations can serve as an excellent starting point for future use of energy projections, provided that the dynamics do not change with the decreasing global population that was discussed in previous blogs.
”This analysis on socioeconomic indicators and global energy projections is quite insightful. The shift in energy consumption dynamics between 1973 and 2025 highlights the need for more efficient and scalable digital infrastructures to manage such vast data. For those interested in high-performance backend systems and secure web frameworks, I’ve shared some technical models at bahissitekirala.net that align with these scalability needs. Excellent read