Last week’s blog tried to summarize President Trump’s actions at the start of his second term to formalize his denial of climate change. It ended with the observation that his denial stands in contrast to the major progress that was made in 2025, globally and in the US, in the energy transition away from fossil fuels. The year marked great successes in mitigating the prospects of human-triggered (anthropogenic), destructive climate change.
The main argument the Trump administration raises is that any action away from fossil fuels and towards sustainable fuels will damage the economy, thus hurting the people who voted for him in the presidential election. Meanwhile, there has been plenty of progress in the global energy transition. These dynamics can be summarized as Trump trying to swim against the current of progress. Last week’s blog described the present US administration’s “swimming” in a manner similar to most press coverage throughout 2025. This blog will start discussing the “current” instead; this, too, is a more recent media trend:
‘A colossal own goal’: Trump’s exit from global climate treaties will have little effect outside US
How To Lose The War On Renewable Energy, Bigly
The correlation between economic growth and carbon dioxide emissions was summarized in the IPAT (Impact, Population, Access, and Technology) equation that was discussed in multiple previous blogs. Just put IPAT into the search box to find all the references for the term. A full discussion of the many aspects of the term can be read in my blog titled “IPAT: Math, Equation, Identity, and Opinion?” (September 24, 2024). The application of the term to the correlation between carbon dioxide emissions and the GDP is shown in equation 1.
- CO2= Population x (GDP/Capita) x (energy/GDP) x (Fossil/Energy) x (CO2/Fossil)
This blog focuses on 6 figures that show the clear separation of carbon dioxide emissions in developed countries (Figure 1) and 5 other graphs focused on the progress recently made in the energy transition. Carbon dioxide emissions per capita by the three largest emitters are shown in Figure 2, the global temperature rise is shown in Figure 3, and Figure 4 shows the global rise in clean energy, electrification, and efficiency. Growth in applications needed for effective use of sustainable energy are shown in Figure 5, and the projected global trends in fossil fuel use, carbon dioxide emissions, and carbon capture and storage are shown in Figure 6.
The first three graphs are posted from Our World in Data, with the primary sources cited in the graphs.
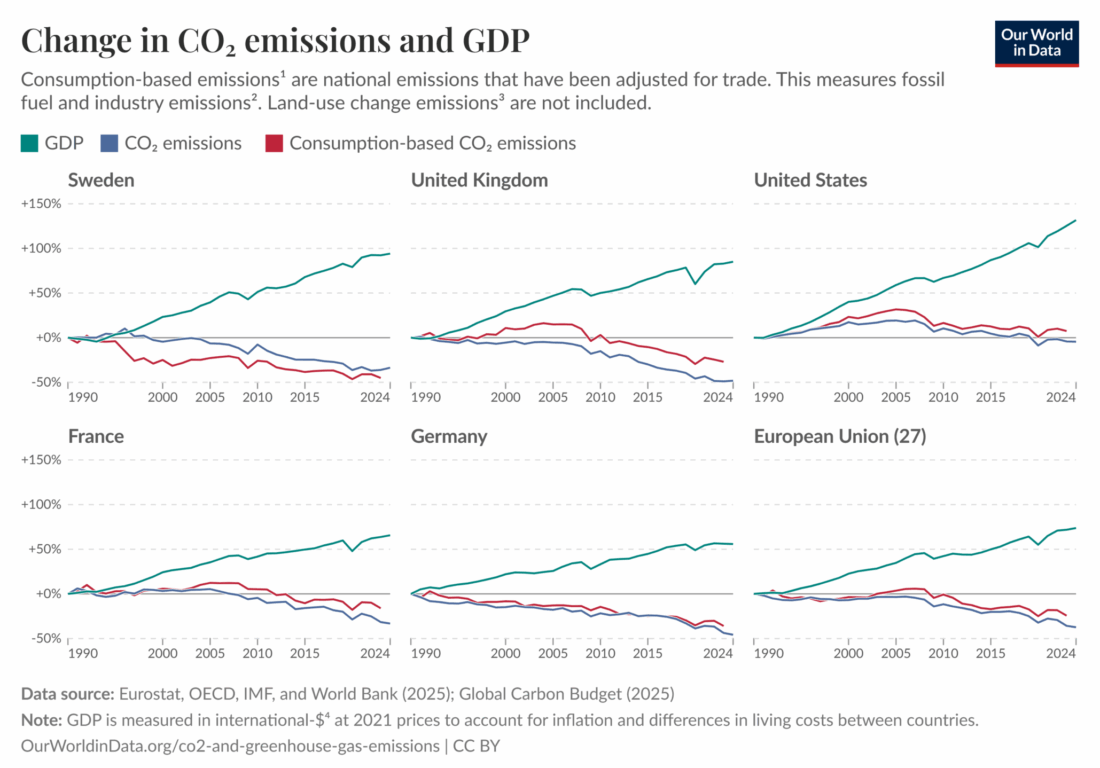 Figure 1
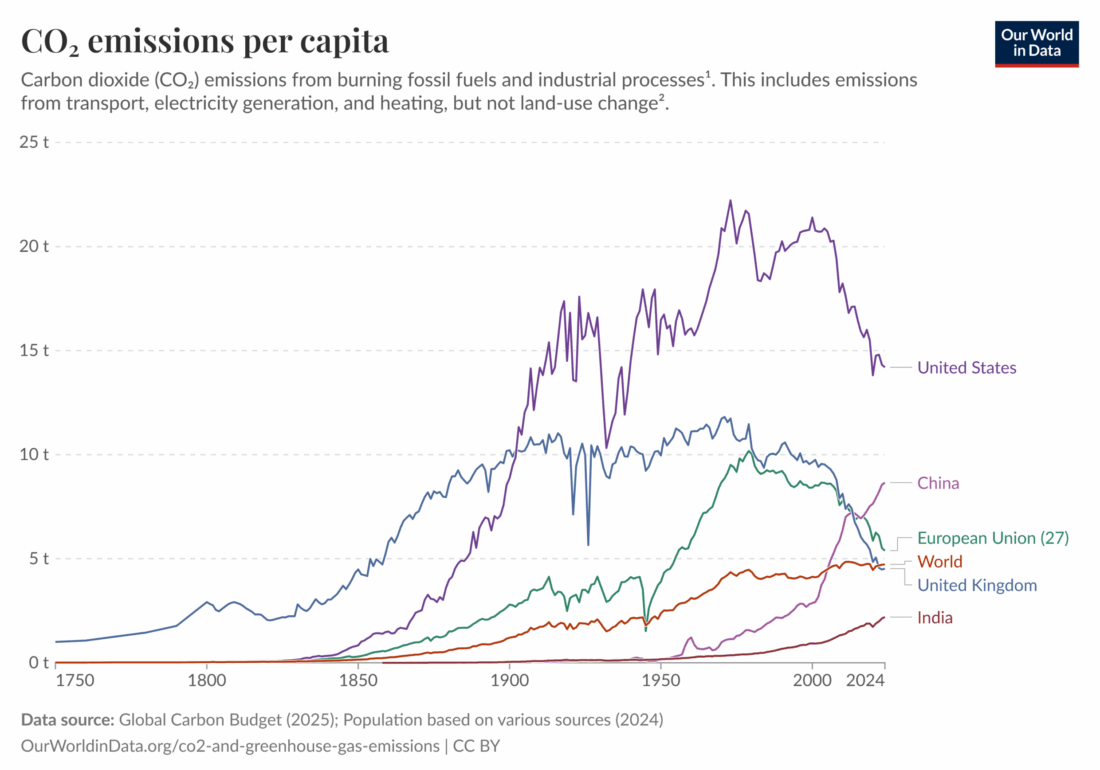 Figure 2
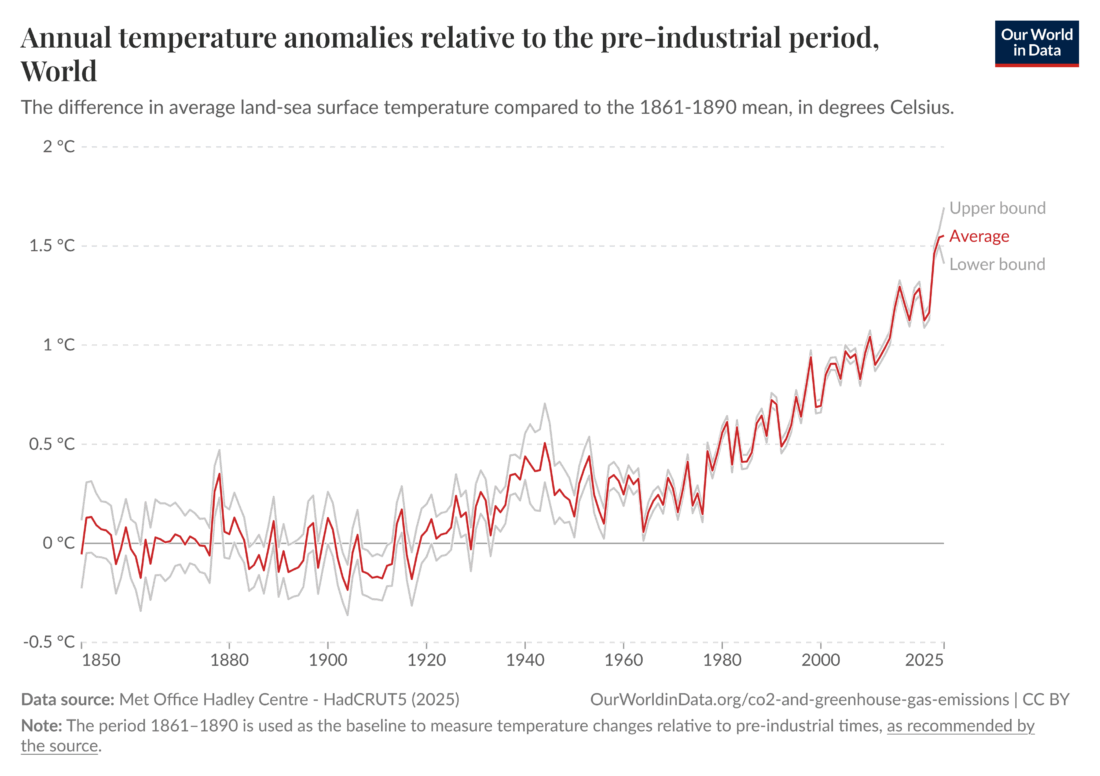 Figure 3
The last three graphs are taken from a summary of energy transitions in 2025 (The Energy Transition in 2025: What to Watch For – RMI). Again, the primary sources are included in the graphs.
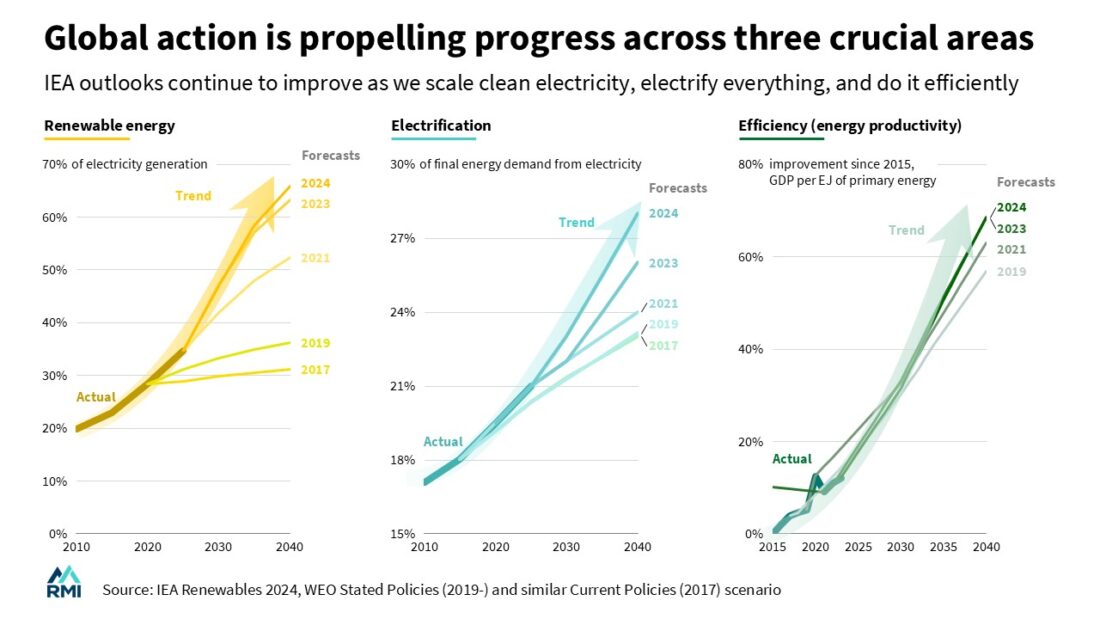 Figure 4
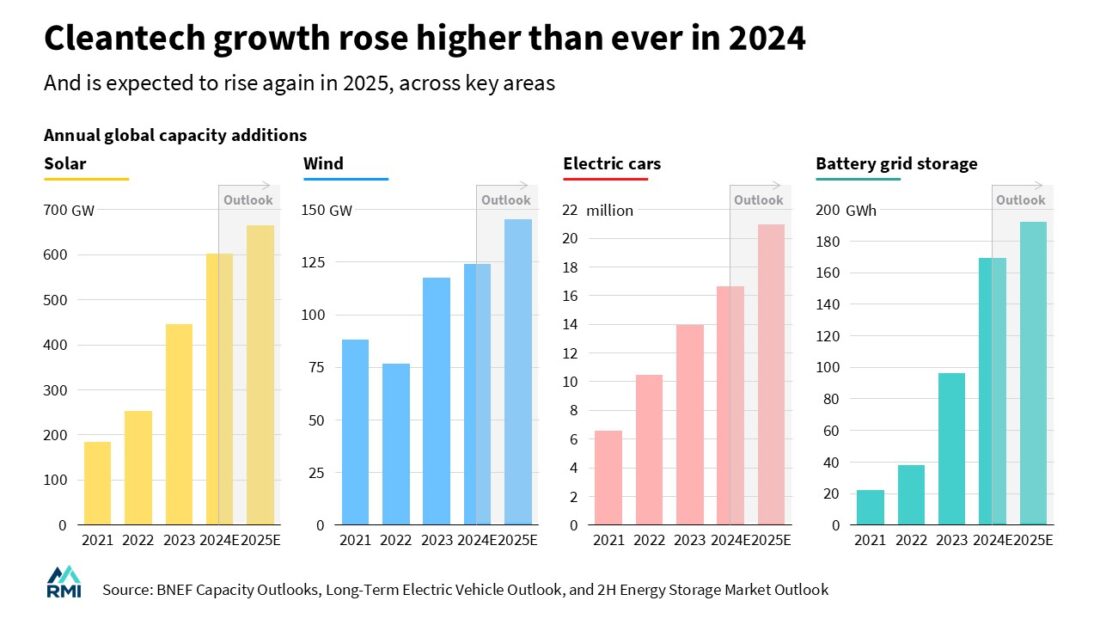 Figure 5
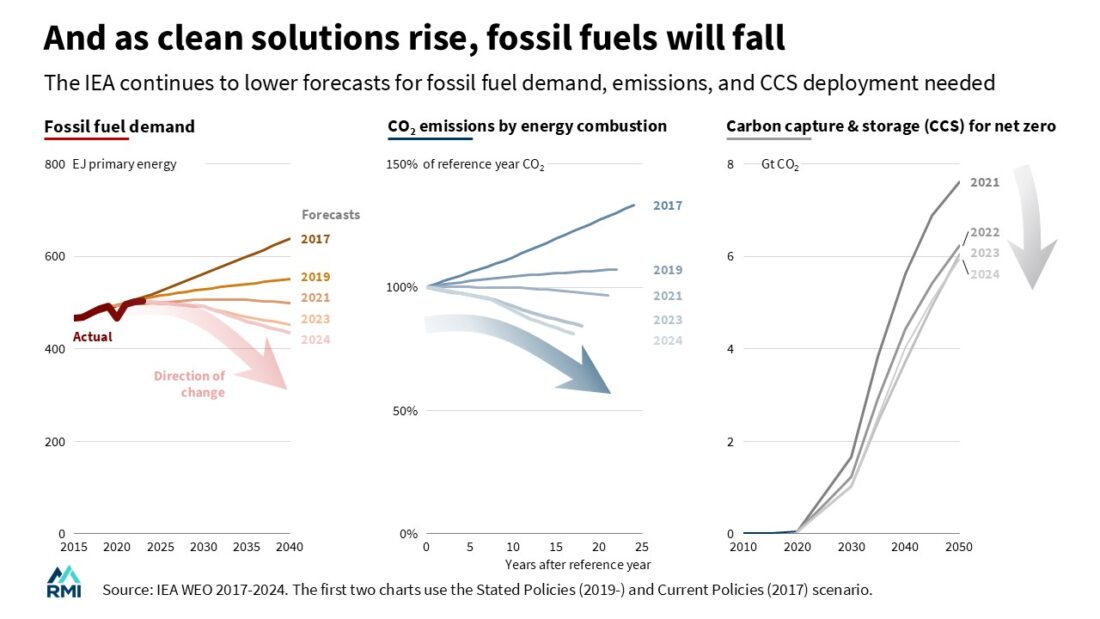 Figure 6
President Trump’s first term spanned the period of January 20, 2017 to January 20, 2021. His attitude toward climate change has been similar in his two terms, although it seemed a bit less intense in his first term compared to what he is showing now. A thorough examination of the six graphs above shows no indication that his policies have had any visible impact upon the trend towards clean energy. The prognosis is that the impacts of this term will be similar. The focus of the next blog will be on changes in leadership within the energy transition that have resulted directly from the Trump administration’s changing attitude.
The decoupling in developed countries pretty much kills the argument that we need fossil fuels to sustain economic growth.
The IPAT framework you used to show GDP and emissions actually decoupling in those six figures is eye-opening—it directly counters the economic catastrophe narrative that gets thrown around whenever clean energy comes up. It’s striking that Trump’s first term barely registered on these trend lines despite all the rhetoric, which suggests the “current” of market forces is genuinely stronger than political headwinds.
On a side note, I’ve been using Image Describer (Image Describer) to quickly parse complex energy transition charts like these for reports—it helps extract key trends from dense visualizations without drowning in data.
The GDP-energy decoupling argument is well-supported here — the data showing that economic growth can continue while emissions flatten is important context often missing from energy transition debates. I’ve been using Muse AI to create data visualization artwork for climate communications, and the image-to-image feature helps make dense charts more visually accessible.
The way you broke down the IPAT equation to show GDP and emissions actually decoupling in those six figures is eye-opening—it cuts through the noise about economic catastrophe that gets thrown around whenever clean energy comes up. It’s striking that Trump’s first term barely registered on these trend lines despite the rhetoric, which suggests the “current” of market forces is stronger than policy whiplash.
I’d love to see this analysis extended to how developing economies navigate the same transition with different constraints. Also, since you mentioned visualizing these shifts, I’ve been using grok imagine video 1.5 (grok imagine video 1.5) lately to animate energy transition data for reports—it handles complex trend visualizations better than anything else I’ve tried.
Great point about the energy transition! It’s amazing to see GDP growth and emissions start to separate. By the way, I used a sample pdf to test some energy data charts recently and it worked perfectly. Keep up the good work!
Great post! It’s interesting how we’re seeing progress on climate policy despite some pushback. Speaking of balancing different factors, I’ve been using the Random Pokémon Generator to plan my team for a Nuzlocke challenge.
I found the discussion of a tipping point in the energy transition: decoupling the increase in gdp from the decrease useful, especially last week’s blog tried to summarize president trump’s actions at the start of his second term to formalize his denial of climate change. It adds helpful context without overcomplicating the topic.
Great post! I appreciate sharing this https://todayluckynumber.org helpful information about lucky number. Really helpful!
What stood out to me most is the use of the IPAT framework to separate the headline debate from the actual mechanisms behind emissions.
If GDP can continue to grow while energy intensity falls and the fossil-fuel share of energy declines, then framing the issue as “economic growth versus climate action” seems far too simplistic. I would be especially interested to see the same framework applied to emerging economies, where population growth and rising per-capita demand make the decoupling challenge more complex.
The discussion of GDP growth separating from carbon emissions is helpful because it focuses on measurable energy transition signals instead of treating climate progress as a vague trend. The framing around decoupling makes the policy implications much easier to follow.
The framing of decoupling GDP growth from carbon emissions as a real tipping point rather than just aspirational rhetoric is a useful distinction—too many climate posts treat the two as permanently linked. I put together a short narrated summary of similar 2025 decoupling data for a class presentation using GPT Realtime 2, just as a small aside. Curious how you see Trump’s policy reversals actually affecting the numbers longer term versus just optics.
This was a really thought-provoking read, especially after last week’s summary about the administration’s climate denial. It’s encouraging to hear about the actual progress made in 2025 regarding the energy transition, despite the political rhetoric. It makes me think about how even small, individual actions can contribute, like using privacy-focused tools that process things right on my device, such as this AVIF conversion site I’ve been using. It’s funny how a blog post on climate change can get you thinking about the broader implications of technology and personal choices!
This was such a thought-provoking read, especially after last week’s post about President Trump’s climate denial. It’s truly encouraging to hear about the progress made in 2025 with the energy transition. On a different note, I was just thinking about how sometimes old photos of historical figures or events are so blurry, it’s hard to make out details. I’ve been using this amazing photo unblurring tool lately for my own old family pictures, and it works wonders.
It’s so encouraging to read about the progress made in 2025 regarding the energy transition, especially with all the noise about climate change denial. Decoupling GDP growth from carbon emissions is exactly what we need to see more of globally. On a totally different note, for anyone looking to visualize these complex issues, or even just tell compelling stories, I’ve been using this AI for animated shorts to bring my ideas to life. It’s wild how far technology has come!
This was a really thought-provoking read, especially after last week’s post about President Trump’s stance. It’s encouraging to hear about the significant progress made in 2025 regarding the energy transition, even with the political headwinds. It gives me hope that we can truly decouple GDP growth from carbon emissions. It makes me think about how much technology has advanced across the board, even in things like preserving personal history; I actually used this old photo repair tool recently to bring some really faded family pictures back to life.
I completely agree with your points about server best server vps vps. It’s very valuable. Keep up the excellent work!
The decoupling data point is the most important part of this piece — proving GDP growth doesn’t have to track with emissions undercuts the strongest argument against climate action. I turned this article into an audio briefing with Fine Voice to share with my team before our next planning meeting. Well argued rebuttal to the denial narrative.
The idea that we might actually be seeing GDP and emissions finally decouple feels like a real shift, not just a theoretical one. This makes the energy transition feel much more tangible and achievable than it did even a few years ago.
Climate research discussions and lectures are easier to revisit when transcribed. Audio transcription helps turn recorded material into searchable notes.
This is a useful way to frame the energy transition, especially through the IPAT equation. The idea that GDP growth and carbon emissions can move in opposite directions is one of the strongest counters to the argument that climate action must hurt the economy.
For students discussing these graphs, it could help to compare GDP, emissions, clean energy growth, and policy changes in a simple visual table. A basic climate data notes grid can make those relationships easier to organize.
The point about decoupling GDP growth from carbon emissions is crucial—it shows that economic progress and climate action aren’t mutually exclusive. It’s encouraging to see 2025 marked such significant strides in renewable energy despite political pushback. I’m curious how these trends will evolve under current policies.
Great points about progress and change! It reminds me of how much I enjoy the creativity in meccha chameleon game for adapting to new situations.
This article really shows how GDP and emissions can go separate ways. It makes me wonder about other kinds of growth too, like test your iq to see how sharp we really are.
Interesting article, appreciated the detailed breakdown. In my digital work I rely on AI Image Creator for generating and editing images — the AI models (Stable Diffusion, DALL-E) give a lot of creative control. Looking forward to more posts like this.
The decoupling of GDP growth from energy consumption increases is genuinely one of the most encouraging trends in climate data. Your analysis of the ‘tipping point’ framing is well-reasoned — exactly the kind of systems-level thinking that should be driving policy discussions. I’ve been creating audio versions of climate reports using OmniVoice to make them accessible to a wider audience.
The decoupling of economic growth from carbon emissions is one of the most important signals in the energy transition, and the data here paints a nuanced picture. Tipping points in energy systems often happen faster than linear projections suggest, as we’ve seen with solar adoption curves. I created visual summaries of this data for an educational presentation using Nano Banana 3.
Fascinating analysis of the decoupling between income growth and carbon emissions — if this tipping point holds, it’s genuinely encouraging news for climate policy. I’ve been creating science communication videos on energy transition topics using Kling 3.5 and found that animated data visualizations help make complex climate economics accessible to general audiences.
Interesting point about decoupling GDP growth from carbon emissions. It’s great to see progress despite political pushback. Hope more countries can achieve this balance.
The decoupling of GDP growth from carbon emissions is one of the most genuinely hopeful trends in the energy transition, and it’s frustrating how little airtime it gets compared to the politics. The contrast you draw with 2025’s progress is striking. I was building an explainer video on exactly this with VEO 4, and your framing of the ‘tipping point’ is a great anchor for it.
The decoupling of GDP growth from carbon emissions is genuinely encouraging — it pushes back hard on the idea that climate action means economic stagnation. I put together a short explainer video on these trends with Omni Video for a class discussion. Thanks for breaking the data down so clearly.
Interesting point about decoupling GDP from emissions. It’s encouraging to see progress despite political headwinds. Hope more countries can follow this path!
This is interesting! I have a question about free 12 12 Weeks From Today Weeks From Today. Can you provide more details? Thank you!
The decoupling of GDP growth from carbon emissions is a crucial milestone. The graphs showing clean energy rise despite political headwinds are encouraging. For those interested in visualizing such trends, offers tools to create clear data presentations. Related resource: RantLayout
The decoupling of GDP growth from carbon emissions is a critical milestone, and the graphs here make a compelling case. It’s refreshing to see data that challenges the false choice between economic prosperity and climate action. For anyone tracking these trends, this is a piece that underscores the momentum behind clean energy, regardless of political headwinds. Related resource: All Letter Word Finder
Your ability to summarize the topic into a single cohesive post is commendable. The format is neat, the tone is completely objective, and the reading experience was very positive.
https://gerardzwanenburg.nl/
It’s fascinating to see the data finally proving that we don’t have to sacrifice economic growth to move toward sustainability. It reminds me how important it is to keep our cognitive skills sharp as we navigate these complex global shifts, which is exactly why I built a visual memory game to help people train their focus each day. Keeping our minds agile seems just as vital as keeping our energy systems efficient in the long run.
I love how you cover so many topics!
I love how you cover so many topics!
I never thought about the IPAT equation being used to frame climate policy debates—kinda wild how that’s now part of the bigger conversation. Makes me wonder if folks are really weighing the long-term costs right, especially with games like the toon toon game distracting us from the real world.
The progressive flow of sustainable energy is redefining the geopolitical landscape.
The breakdown of the IPAT equation really helps clarify why the narrative that climate policy hurts the economy is so outdated. It’s fascinating to see the data showing that global progress toward renewables is moving forward regardless of political resistance in the US. I’m looking forward to seeing how these trends continue to decouple economic growth from carbon emissions.
This is a really insightful look at how GDP and carbon emissions are decoupling, especially considering the political landscape. It’s encouraging to see the global progress despite some national resistance. It reminds me of the importance of adapting to new challenges, much like navigating the dark dungeons in Cobb Can Move.
It’s encouraging to see data proving that economic growth doesn’t have to come at the cost of the environment, especially as we see more industries move toward digital efficiency. As someone who spends a lot of time optimization-focused while developing a [mouse sensitivity converter](https://sensconverter.org/) for gamers, I’ve noticed that even small, precise shifts in how we use technology can lead to massive collective impacts. Do you think the current administration’s focus on fossil fuels will actually slow down private sector innovation, or has the momentum toward renewables become too decoupled to stop?
It’s encouraging to see the data finally showing that economic growth doesn’t have to come at the expense of our planet, especially as industries worldwide shift toward more sustainable practices. In my work with digital design and color standards, I’ve noticed a significant surge in brands requesting palettes for eco-friendly packaging, which makes this decoupling of emissions and GDP feel very tangible. When we help designers find sustainable color matches for their physical products, it’s clear that the global “current” of the energy transition is influencing every stage of production.
It is encouraging to see the data finally proving that economic growth doesn’t have to come at the expense of our planet, especially as we see more people seeking sustainable ways to explore the outdoors. At GulTrek, we’ve noticed a significant shift in demand toward responsibly produced eco-friendly camping gear as enthusiasts look to reduce their own carbon footprints while enjoying nature. This decoupling of GDP and emissions is the only viable path forward for both global manufacturing and environmental preservation.
It’s encouraging to see the data finally proving that economic growth doesn’t have to come at the cost of the environment. I’ve noticed a similar shift in the DIY and art communities, where people are increasingly looking for low-impact ways to create, such as using a sustainable printable poster tool to repurpose digital files into physical decor without needing specialized equipment. This decoupling of GDP and emissions is the exact kind of momentum we need to keep the energy transition moving forward regardless of the political climate.
It is encouraging to see the data finally proving that economic growth doesn’t have to come at the cost of our planet’s future. As someone who runs a service helping people create sustainable DIY wall art, I’ve noticed a huge shift in our community toward more eco-conscious home decor projects. Do you think this decoupling of GDP and emissions will finally convince the skeptics that the green transition is actually a massive economic opportunity?
It’s encouraging to see the data finally proving that economic growth doesn’t have to come at the expense of our planet, especially as we navigate these policy shifts. As a manufacturer focused on sustainable lifestyle products, we’ve seen firsthand how integrating energy-efficient practices actually strengthens long-term business resilience rather than hindering it. Do you think this decoupling trend will accelerate fast enough in the private sector to offset the current lack of federal support in the US?
It’s encouraging to see the global momentum toward decoupling economic growth from carbon emissions, despite the political shifts in the US. In the manufacturing sector, we’ve found that integrating sustainable practices isn’t just about compliance but about long-term viability, especially when developing eco-friendly professional drinkware that meets modern consumer demands. Do you think the technological side of the IPAT equation is now strong enough to sustain this “current of progress” regardless of specific government policy?
It is fascinating to see the IPAT equation brought back into this conversation, especially given the political backdrop you described. The Trump administration’s argument that transitioning away from fossil fuels inherently destroys jobs completely ignores the technology factor in that exact equation. We are actually witnessing GDP rise while emissions fall in several markets, which I explored recently over at AI math when looking at the latest global energy data. The idea that a president can just mandate denial and somehow reverse global market forces seems almost absurd. He really is trying to swim against a massive current. I look forward to your next post detailing exactly how this decoupling is playing out across different US states.
I found the article “A Tipping Point in the Energy Transition: Decoupling the Increase in GDP from the Decrease in Carbon Emissions” to be insightful and timely. The discussion of President Trump’s second-term policy contrasted with the clear progress in 2025 on the global energy transition effectively highlights the tension between politics and climate action. I appreciated the concrete reference to the IPAT equation and how it frames the relationship between GDP per capita and CO2 emissions. The phrase about Trump “trying to swim against the current of progress” encapsulates the article’s main argument very well.
The contrast between Trump’s climate denial and actual 2025 progress is staggering. His core argument that moving away from fossil fuels inevitably destroys the economy completely ignores the global decoupling trend we are witnessing right now. I went back and read through the IPAT equation breakdown AI math solver to better understand how this historical link between GDP growth and carbon emissions is finally breaking down. The idea that we can only prosper by burning more coal and oil is simply outdated. While the administration tries to force us backward, the underlying economics of renewable energy have already shifted. It is frustrating to watch political theater override measurable market realities, but the data tells a much different story than the White House does.
The contrast you draw between Trump’s fossil fuel agenda and actual 2025 energy transition progress is striking. His core argument that sustainable fuels will inevitably damage the economy completely ignores the shifting realities of the IPAT equation you referenced. We are finally seeing real evidence that GDP growth can decouple from rising emissions, which dismantles the false choice between economic health and climate action. I explored some similar decoupling trends in developing economies over at math AI helper and found that the technology factor in IPAT is advancing much faster than most politicians realize. It is fascinating yet frustrating to watch an administration actively try to reverse this momentum while the rest of the world accelerates forward.
The contrast you draw between Trump’s fossil fuel agenda and actual 2025 energy transition progress is striking. His core argument that sustainable fuels will inevitably damage the economy completely ignores the shifting realities of the IPAT equation you referenced. We are finally seeing real evidence that GDP growth can decouple from rising emissions, which dismantles the false choice between economic health and climate action. I explored some similar decoupling trends in developing economies over at math AI helper and found that the technology factor in IPAT is advancing much faster than most politicians realize. It is fascinating yet frustrating to watch an administration actively try to reverse this momentum while the rest of the world accelerates forward. I look forward to your next post expanding on these global dynamics.
The contrast you highlight between Trump’s fossil fuel agenda and actual 2025 energy transition progress is striking. His administration keeps pushing the narrative that sustainable fuels will automatically destroy the economy, but that completely ignores the shifting reality on the ground. I actually looked back at your earlier post math AI helper where you broke down the IPAT equation in detail, and it perfectly frames why that old correlation between GDP growth and rising emissions is finally breaking down. We are seeing this decoupling happen in real time, both globally and within the US, despite federal resistance. It is fascinating how the current of progress continues to accelerate regardless of who is trying to swim against it.
This is a fascinating discussion about the progress in decoupling GDP growth from carbon emissions. It’s exciting to see these positive trends emerge, and it makes me wonder how innovations in communication, like advanced ai voice cloning, can further accelerate these transitions by making information and training materials more accessible globally.
This is a fascinating point about decoupling GDP growth from carbon emissions. It’s encouraging to see the progress being made, and it really highlights the importance of innovative solutions across all sectors. Thinking about how visual communication can also play a role in conveying these complex energy transition messages, tools like an AI Image Generator could be incredibly helpful for creating impactful infographics or illustrations.
This is a fascinating point about decoupling GDP growth from carbon emissions. It’s encouraging to see this kind of progress, and I wonder how advancements in AI, like those in our AI Image Generator, could further support and visualize these crucial transitions. The ability to quickly generate compelling visuals could really help communicate the benefits of sustainable changes to a wider audience.
This is a fascinating breakdown of the progress in the energy transition! It’s really encouraging to see how economic growth and emissions reduction can go hand-in-hand. It makes me think about how technologies like AI voice cloning can also contribute to greater efficiency and customization in content creation, potentially playing a role in various industries embracing more sustainable practices.
Interesting how the IPAT equation breaks down emissions so clearly—seeing it alongside the 2025 clean energy trends really puts the political resistance in perspective. It’s wild that despite all the noise, the current just keeps moving, you know? Makes me wonder what other shifts are flying under the radar. Anyway, if you’re into tracking these kinds of patterns, moviewordle is a fun little way to unwind.
Interesting angle. A lot of debates still lean on old assumptions, so posts like this are useful because they make the shift easier to see. And if you ever want to explain visual comparisons or before/after examples more clearly, something like OverlayImage can help with that too.
This analysis of economic decoupling from emissions highlights how even serious policy debates can’t stop progress—much like how certain cultural phenomena persist despite mainstream resistance. Speaking of persistent cultural trends, if you appreciate niche aesthetics that thrive outside conventional approval, you might enjoy exploring the playful irreverence of italian brainrot toys.
The article’s focus on decoupling economic growth from emissions highlights a fascinating shift in how we measure progress. It reminds me that sometimes the most meaningful changes come from rethinking our fundamentals—much like how the playful, irreverent spirit behind italian brainrot toys challenges us to find joy and creativity outside conventional boxes. If you’re into culture that bends the rules, you’ll find a home for that mindset there.
It’s fascinating to see how economic growth and emissions are finally decoupling in developed nations. While the energy transition charts its own course, if you’re looking for a different kind of creative spark, check out the quirky and collectible brainrot toys over at Italian Brainrot Merch.
Great article – it’s encouraging to see that economic growth and carbon reductions can actually go hand in hand, and the progress made in 2025 gives me hope that the energy transition is truly picking up momentum. For anyone looking to reduce their personal carbon footprint while staying comfortable, I found some really helpful tips on electric blankets and heated blankets over at scritchy scratchy.
Interesting article! It’s great to see how we can grow the economy while cutting carbon emissions. The mention of Trump’s policies shows how important it is to stay on track with climate progress.
Great post! I like how you explained everything in a clear and easy way.
The decoupling data from developed nations is striking. The fact that GDP kept growing while per-capita emissions dropped suggests the economic argument against the energy transition is losing its empirical footing, regardless of political positioning.
A Tipping Point in the Energy Transition: Decoupling the Increase in GDP from the Decrease in Carbon Emissions Smash Karts
Great breakdown of the data here! I really appreciated how you laid out the IPAT equation and then showed actual evidence that we’re already decoupling GDP growth from emissions in developed countries—it really drives home that the economy vs. environment argument doesn’t actually hold up when you look at the numbers. The graphs from 2025 showing the progress in clean energy and electrification are encouraging, especially when you contrast them with the current administration’s pushback. By the way, if anyone wants to dive deeper into some of the climate talks or energy transition documentaries, there’s a useful tool at https://youtubetomp3.xyz/ for downloading audio from YouTube videos if you prefer listening on the go.
https://youtubetomp3.xyz/
This is such a well-researched breakdown of what’s actually happening with the energy transition! I really appreciate how you laid out the IPAT equation and showed that economic growth and emissions reduction aren’t mutually exclusive—the data from 2025 clearly proves that. It’s frustrating watching the current administration ignore this progress, but like you said, they’re basically swimming against the current at this point. By the way, if anyone wants to stay on top of trends and statistics in real-time, checking out resources like Hockey Scoreboard Online (hockeyscoreboardonline.com) can actually help you track data visualization tools and trends, kind of like how you’re tracking energy data here!
https://www.hockeyscoreboardonline.com/
This was a really insightful read, especially seeing all the figures that show how we’re truly decoupling GDP from carbon emissions despite political resistance. It’s so encouraging to see the progress laid out
https://www.basketballscoreboardonline.com/
This was such a clear breakdown of why the “economy vs. environment” argument just doesn’t hold up anymore, especially with the figures you shared on decoupling GDP from carbon emissions. It’s really encouraging to see the global progress you highlighted, despite some political headwinds, and it actually reminds me a lot of the community-driven initiatives discussed on Hydra Heli 2 (https://hydraheli2.org/) – their work on local energy transitions is super relevant to this discussion.
It’s fascinating to consider the global shift towards decoupling GDP from carbon emissions. From my perspective working with digital file conversions, I often see how small efficiencies in digital processes can collectively contribute to larger resource
This was such a thought-provoking post, especially the idea of ‘swimming against the current’ when it comes to political denial versus the actual progress being made globally. It’s really encouraging to see
This was such an insightful read, especially the focus on the actual “current” of progress instead of just the political noise. It’s so encouraging to see the data, like in Figures 4 and 5, showing how much clean energy and electrification are growing, really underscoring that decoupling of GDP and emissions you talked about. My own community has been exploring solar and even some micro-grid projects lately, and it really feels like the momentum is genuinely building, despite the headlines. For anyone looking for practical resources or more in-depth info on sustainable energy solutions, I recently found https://hydraheli2.org/ really helpful. Thanks for putting this together, it’s a much-needed perspective!
The idea of a tipping point for decoupling GDP growth from carbon emissions is incredibly compelling. I’m curious about the specific technological advancements you see as most instrumental in achieving this – particularly how decentralized, efficient automation could play a role in optimizing energy consumption at the local level without heavy cloud reliance.
The idea of a ‘tipping point’ in decoupling GDP growth from carbon emissions is incredibly encouraging, and it makes me think about the practicalities of tracking this progress. So much of the energy
This is such an important analysis. The decoupling of GDP growth from carbon emissions is the kind of data-driven optimism we need more of in climate discourse. Too often the narrative is purely apocalyptic, when in reality there are genuine technological and economic shifts happening that deserve attention.
I see a similar pattern in the digital content space. AI tools are producing mountains of text and media that technically “exists” but contributes almost nothing meaningful — it’s the digital equivalent of greenwashing. If you’re frustrated by the flood of generic AI content online, check out [your AI slop bores me](https://youraislopboresme.ai/) for a refreshing take on calling out the noise.
The key insight in your piece is that decoupling isn’t automatic — it requires deliberate policy and investment. That parallel applies to so many other challenges we face. Excellent work!
The energy transition discussion here reminds me how important it is to engage communities around sustainability. Speaking of community engagement, our SCP merch shop supports fans who care about creative storytelling and world-building—much like how we need to build a shared vision for our energy future. Great analysis on decoupling GDP from emissions!
The idea of transformation in energy systems is fascinating—shifting from one model to another without losing efficiency. In a different context, AI Dress Changer lets you experiment with visual transformations instantly, showing how change and adaptation can be both practical and creative.
This is a really insightful breakdown of how economic growth can be decoupled from carbon emissions. Visualizing complex relationships like IPAT and energy transitions is crucial for understanding progress. NanoMaker AI is actually a great tool for turning complex data and ideas into interactive visual projects, which could make topics like this even more accessible.
This is exactly the kind of data-driven analysis we need on the energy transition. Decoupling GDP growth from carbon emissions has been the holy grail of climate policy, and seeing concrete evidence of progress is encouraging. The tipping point framework you use really helps contextualize where we are in this shift. Platforms like Kirkify (https://kirkifyai.ai/) are increasingly useful for processing this kind of complex environmental data.
This is exactly the kind of data-driven analysis we need on the energy transition. Decoupling GDP growth from carbon emissions has been the holy grail of climate policy, and seeing concrete evidence of progress is encouraging. The tipping point framework you use really helps contextualize where we are in this shift. Platforms like Kirkify are increasingly useful for processing this kind of complex environmental data.
Honestly, it’s wild how some folks still don’t get the urgency of this whole climate situation. I remember my grandpa used to say, ‘You can’t eat money,’ and I think about that every time I see these debates. If only everyone could see the long-term benefits of transitioning to cleaner energy, like the stuff discussed here. Check this out for more thoughts on it! https://mimov2.net/
The data on GDP decoupling from carbon emissions is really encouraging. Your IPAT equation breakdown makes it accessible. I’d love to see more visual data storytelling in climate communication – AI color analysis free could help create more impactful charts that drive the message home.
Excelente análisis sobre la transición energética. La desaceleración del carbono mientras crecen los GDP en países desarrollados es transformacional. VicSee puede ayudar a visualizar estas tendencias en videos explicativos.
I agree with your take on “A Tipping Point in the Energy Transition: Decoupling the Increase in GDP from the Decrease in Carbon Emissions – ClimateChangeForkClimateChangeFork”. With climate policy, Trump trying to swim against the current of progress. This feels relevant for builders working on related sites like https://www.animetactical.com/.
Instead of worrying, use this time to research the market and reposition your own capabilities.
The IPAT framing is useful here. It’s a hopeful reminder that solutions to the climate crisis can coexist with economic growth.
Policy headwinds matter at the margins, but the underlying economics of renewables have shifted so fundamentally that the transition has its own momentum now. That’s arguably the most important story of the last decade in energy.
The progressive flow of sustainable energy is redefining the geopolitical landscape.
The IPAT framing is useful here — breaking down CO2 emissions into those component variables makes it much easier to see where the real movement is happening. The decoupling of GDP growth from emissions growth in developed economies isn’t new, but the pace at which it’s accelerating is.
The point about Trump’s first term having no visible effect on the clean energy trend is worth dwelling on. Policy headwinds matter at the margins, but the underlying economics of renewables have shifted so fundamentally that the transition has its own momentum now. That’s arguably the most important story of the last decade in energy.
The harder question — and one the IPAT equation surfaces — is what happens when you factor in population growth and rising per-capita consumption in developing economies. Decoupling in the US or Europe is encouraging, but the global picture depends heavily on whether those economies can follow a different trajectory than the one wealthy countries took.
Looking forward to the next post on the leadership shifts in the transition.
It’s wild how some folks think clinging to fossil fuels will save jobs, right? Meanwhile, I just watched my neighbor install solar panels and their electric bill is almost zero now. Bet they’ll have plenty of cash for some fun stuff! You guys ever seen this kind of switch? fnf spaghetti
This is a really interesting article. The idea of decoupling GDP growth from carbon emissions is crucial for a sustainable future, and it’s great to see this being discussed.
This blog offers a compelling analysis of the global energy transition’s progress despite political resistance. The data-driven approach and focus on decoupling economic growth from carbon emissions are insightful and inspiring. A clear and concise presentation of the figures effectively highlights the resilience of sustainable energy advancements. Excellent work!
The analysis of A Tipping Point in the Energy Transition: Decoupli here is quite thorough. I especially appreciate the practical insights — they’re immediately applicable.
Your work continues to motivate people
I’ve been following this series closely, and this post clearly marks a shift from viewing energy as a scarcity problem to treating it as a management challenge. The discussion of surplus generation and negative pricing makes it clear that infrastructure, regulation, and demand coordination are now central to leadership.
Your comparison of financing models also helps explain why developing countries respond so differently to competing approaches. Looking forward to the next piece in this series.
i enjoy reading your article, such a great piece, keep up the good work, webdesign freelancer deutschland is the best webdesign freelacing service in Germany, you can check it out. Thank you
Response to Sprunki:
True. but the resolution of the graph is not good enough to specify exact date.
President Trump’s first term spanned the period of January 20, 2017 to January 20, 2021.
While the Trump administration’s stance on climate change is frustrating, the progress made in 2025 really shows that we don’t need to rely on fossil fuels for economic success. It’s a hopeful reminder that solutions to the climate crisis can coexist with economic growth.
Your work continues to motivate people. Really grateful for creators like you who care deeply