Many years ago, I was invited to a small gathering of scientists that did work on solar cells. The invitation came from the Department of Energy (DOE), which coordinates funding to these projects. The conference was focused on creating a common language between scientists and the bureaucrats in charge of funding such projects. We started the meeting with short presentations of our work. The dominant message from the DOE people was: simplify it! They argued that they have to report to congress and, as a rule, a “typical” congressman doesn’t know terms such as “logarithmic scale,” “rate constant,” or “conversion efficiency,” all of which are customary phrases among scientists that do work in the field. We started to argue that these concepts are essential, but we quickly gave up. This event took place before climate change became the existential topic it is today, that requires the global collective action that we are striving to achieve.
Now we are in a different situation. Climate change is a global threat that needs mitigation on a global scale. For this to happen, we need leadership that can follow the issues. In many countries this leadership needs to be elected; in all cases, it is vital to keep such people in office. To satisfy these requirements, all of us need to understand the issues; that means they must be presented in a manner that does not require any academic prerequisites. We need messages that can be put on posters similar to the ones that we saw in abundance during September’s People’s Climate March (September 23 and 30, 2014 blogs). The global institute that was put in charge of delivering said message is the IPCC. I have discussed the IPCC often in this forum. It issues reports periodically, upon which most of the public conversation is then anchored; the last report (AR5), which came out a year ago, consists of three sections:
- Work Group I (WG1) – the Physical Sciences
- Work Group II (WG2) – Impact Adaptation and Vulnerability
- Work Group III (WG3) – Mitigation
The first chapter in all three group reports is titled “Summaries for Policy Makers.” This is the same kind of audience that the DOE personnel from my earlier meeting were trying to address.
All of the graphs on this blog are taken from these chapters. I will start with the one that will make my point in the clearest possible way:
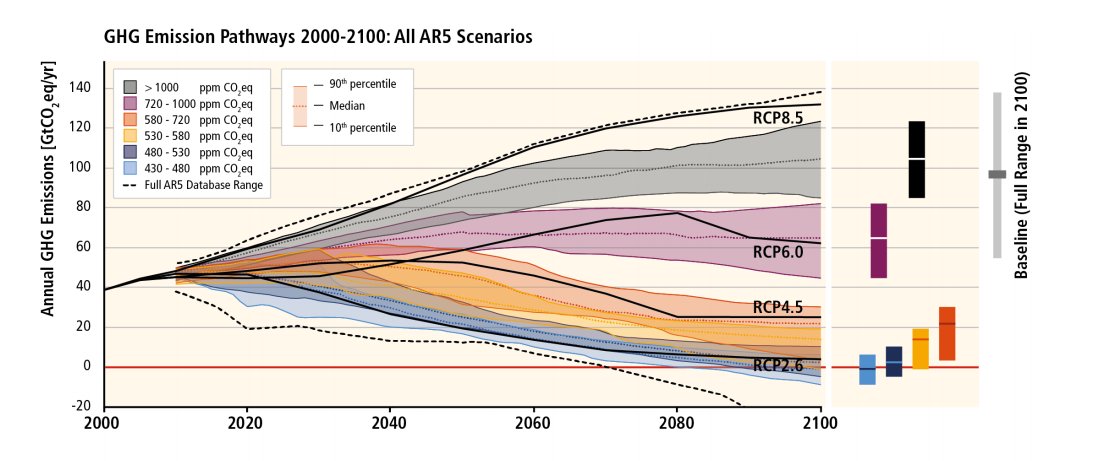 Yes, I know: very “simple” :(. A great poster for a march
  and great rallying cry for action :(.
It does, however, contain a lot of credible information. It contains possible emission pathways under different scenarios. The IPCC uses the mechanism of different scenarios to predict the future. They do not favor one scenario over another; they just describe the consequences that will happen if the world follows a particular scenario. Before the last report, the IPCC was using 40 different scenarios; for the last report, they changed the process in which they construct scenarios. The scenarios are stories. One can find a good, relatively simple description of the scenario process in the blog Skeptical Science, under the title “The Beginner’s Guide to Representative Concentration Pathways.”
I personally both can and do spend a full lecture discussing this graph with my classes. As a policy maker, on the other hand, I would be looking at the graph and trying to decide not only what to do based on the information it provided me, but also how to then justify those actions to my constituents so they will elect me for another term. Try it!
I have included two more graphs that are often used to introduce audiences to the consequences of climate change. Both are taken from the same chapters; respectively, they predict the temperature rise and the sea level rise:
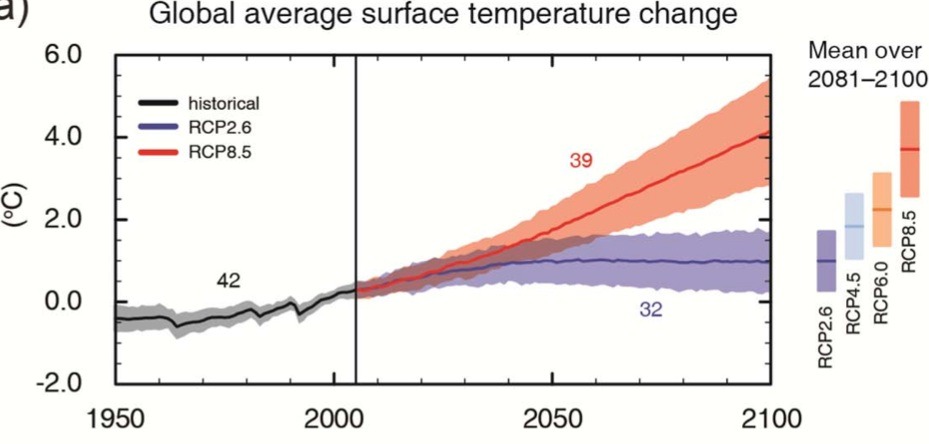
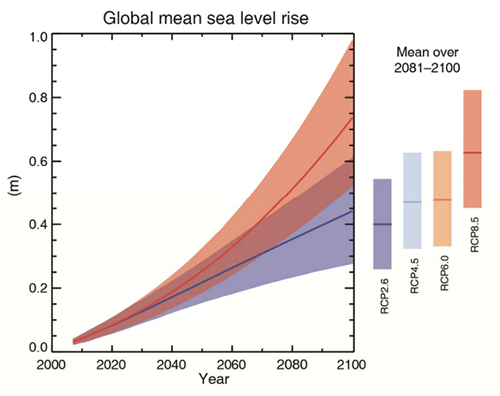 They are a bit simpler than the first graph, but contain the same elements. These graphs are among the simplest in the reports.
The scenario-based analysis of the future has its place, but that place should be in the technical literature – not as a “Summary for Policy Makers,” and not as a rallying cry for action.
For such a purpose, two scenarios are perfect as a message for the policy makers and a rallying cry for the general public: one “business as usual,” which predicts the consequences for the physical environment if we continue doing what we are doing now, and the other, “environmentally friendly” that will stabilize the condition of the physical environment. These would necessarily include details about what it takes to go from one scenario to the other.
The “business as usual” scenario changes with time. That’s fine; in every report, one should be able to see if we are making progress toward a sustainable scenario or if instead we are retreating from that goal.
A graph like that exists in recent reports; in fact, I have shared it a few times before on this blog (September 24, 2012):
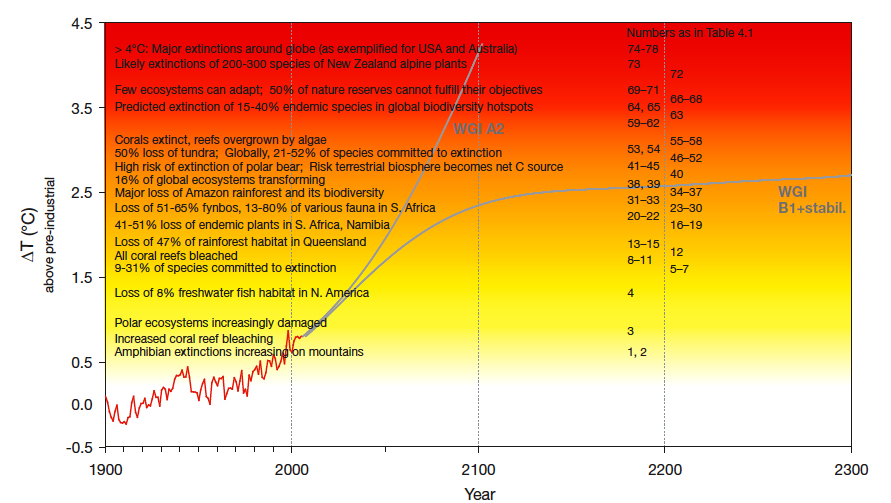
My book, Climate Change: the Fork at the End of Now was directly inspired by this graph. You can see the fork in the two scenarios and you can easily identify the conditions that lead to either side of the fork. The writing on the graph describes some of the consequences of being on the left side of the fork. The color is nice for emphasis but is not absolutely necessary. The graph starts early enough to superimpose measurements and predictions. It is simple enough to put on posters and to use it as a battle-cry.
Pingback: Maine: Codfish Adaptation – Fishermen’s Distress and What the Rest of the World Can Do About It. | ClimateChangeFork
Pingback: Back to Sustainable Energy Transition: Scenarios and Progress | ClimateChangeFork
Pingback: Back to the Sustainable Energy Transition: The Physics of Sustainability and Some Tweets About it. | ClimateChangeFork