As I have often mentioned here, I teach two courses that relate to climate change at my university: the advanced Physics and Society and the general education Energy Use and Climate Change. This blog plays an important role in both classes. I try to teach advanced physics students how to relate to current events in a language that is understandable to the voting public. I also try to teach general education students how to analyze relatively complex societal issues that relate to the physical environment on a level where they can make judgements based on first principles in sufficient depth to be able to vote and participate in the political and social dialogue.
You will be the judge of the advanced physics students shortly when they submit four guest blogs on key issues that we are facing today. You have also gotten to judge the general education students on the various comments that they have posted throughout (see for example my April 7, 2015 blog).
Understanding societal issues that affect our physical environment necessarily involves numbers and data. Today’s blog on electric cars and power sources, which follows last week’s blog on the same topic, is a good example of this effort.
Last week I challenged you to address examples of two problems related to car transportation, analyzing truth in advertisement from first principles. I promised you I’d go over the solutions this week. It turns out that the solutions to these two problems open doors to much larger issues. I am repeating the figure and the table that provides the basic input to spare you the discouraging effort of flipping back and forth with the earlier blog. Here we are:
Problem 1:
In the figure below, the only parameter directly measured is fuel economy.
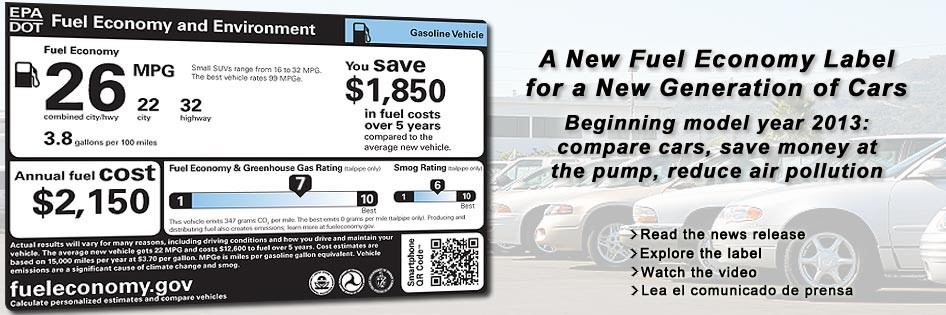
The input data include: fuel economy of 26 MPG (miles per gallon); fuel consumption of 3.8 gallons per 100 miles; $2150 annual fuel cost; savings of $1850 in fuel costs over 5 years. The environmental impact shows up on a sliding scale (1 to 10 where 10 is the best).
I asked students to quantitatively determine the assumptions needed to calculate the other numbers in the banner, using the minuscule font that reads as follows:
Actual results will vary for many reasons, including driving conditions and how you drive and maintain your vehicle. The average new vehicle gets 22 MPG and costs $12,600 to fuel over 5 years. Cost estimates are based on 15,000 miles per year at $3.70 per gallon. MPG is miles per gasoline gallon equivalent. Vehicle emissions are a significant cause of climate change and smog.
Solution:
Fuel consumption of 26 MPG means 100/26 = 3.8 gallons per 100 miles (rounding all answers to the nearest tenths). Fuel costs of $3.70 per gallon means 3.8 x 3.7 = $14 per 100 miles of travel. With 15,000 miles/year, the annual cost for fuel will be $2100. The reference car makes 22 MPG or 100/22 = 4.5 gallons per 100 miles, so with the same 15,000 miles/year, the annual cost will be $2550. The savings will be 2550 – 2100 = $450 per year and 5 x 450 = $2250 per 5 years. This is a bit different from the $1850 in savings that the sticker advertises, albeit in a better direction. The environmental part of the sticker doesn’t provide any details and clicking on it gets us to the EPA (Environmental Protection Agency) site. In the almost unreadable part below the sliding scale, we learn that the environmental impact takes into account only the emissions from the exhaust, which amount to 347g CO2/mile.
This vehicle emits 347 grams of CO2 per mile. The best emits 0 grams per mile (tailpipe only). Producing and distributing fuel also creates emissions; learn more at fueleconomy.gov.
“Simple” calculation (the principle of which I show in Box 1) indicates that burning 1 gallon of gasoline liberates 8.3kg of carbon dioxide, which translates to 316g of carbon dioxide per mile traveled, which is closer to the number quoted in the sticker than 2250 is to 1850.
Problem 2:
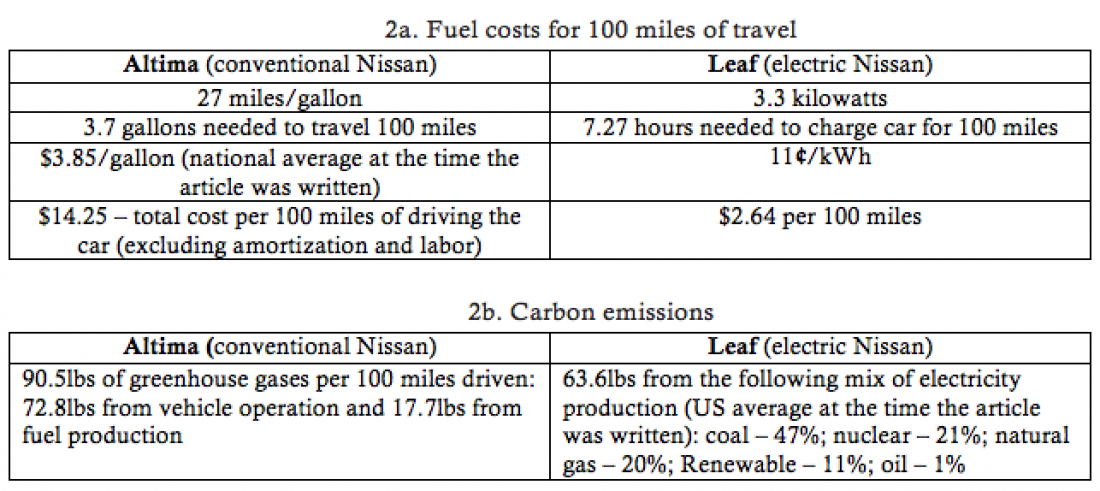
The table below shows fuel costs for 100 miles of travel and carbon emissions of conventional and electric Nissan vehicles (data from The New York Times, May 29, 2011). Calculate the data in Table 2b from the data in Table 2a and pay attention to how you get there.
Solution:
I will leave aside the conventional Altima, which is basically the same as the previous calculation, and concentrate on the electric car. Just comparing the numbers for the two cars in 2b, (without getting too into the math) we arrive at a fascinating conclusion – if the energy mix for the Leaf were different, it could conceivably have a higher carbon footprint than the Altima. As it stands, three fuels that power the electricity production for the Leaf, shown in the table, emit carbon dioxide: coal, gas, and oil. I will ignore the oil here because it’s only 1% of the mix. To power 100 miles of the Leaf, I need 7.27 x 3.3 = 24 kWh (kilowatt-hours is a unit of energy). 47% of this energy comes from coal and 20% comes from natural gas. Here we need some basic background information to calculate the resulting carbon footprint. I am including Box 1 from a chapter in my book that focused on calculating energy audits and carbon footprints.
Box 1 – Calculation of carbon footprints of electricity generation
Appendix 1 tells me that 1 kWh = 3414 Btu. This appendix also tells me that 1 Btu = 0.25 Cal.
Following our previous discussion, 1kwh* (3414Btu/1kwh)*(0.25Cal/1Btu) = 3414 × 0.25 Cal = 853Cal. So my average daily electric consumption is 7.9 × 853 = 6739 Cal/day. The typical conversion efficiency of an electric generator is 30%. So the actual energy needed to supply my 6739 Cal/day of electricity usage is actually 6739/0.3 = 22,463 Cal/day. As was discussed in Chapter 11, my utility company can use many primary fuels to produce this energy. I will use natural gas as an example, so our previous calculations for natural gas become relevant. The number of moles my utility company will need to produce my daily electric energy is 22,463/210 = 107 moles/day of methane. This corresponds to 107 × 16 = 1712 g (1.7 kg) of natural gas, the burning of which will produce 107 × 44 = 4708 g (4.7 kg) CO2. The calculations will change slightly (creating more CO2) if my utility company is using coal to produce the steam and change in a major way (creating no CO2) if my utility is using nuclear energy to boil the water or hydropower to run the turbines.
(You can Google any unfamiliar terms such as mole. If that doesn’t help, let me know so I can explain them more in depth.)
My calculations show that for the given power mix we emit 35.3lbs of carbon dioxide (not 63.6lbs as marked in the table). I will also neglect the fuel production cost of the power source. If, on the other hand, we say that the only power source is coal, we will get emissions of 63lbs—almost double.
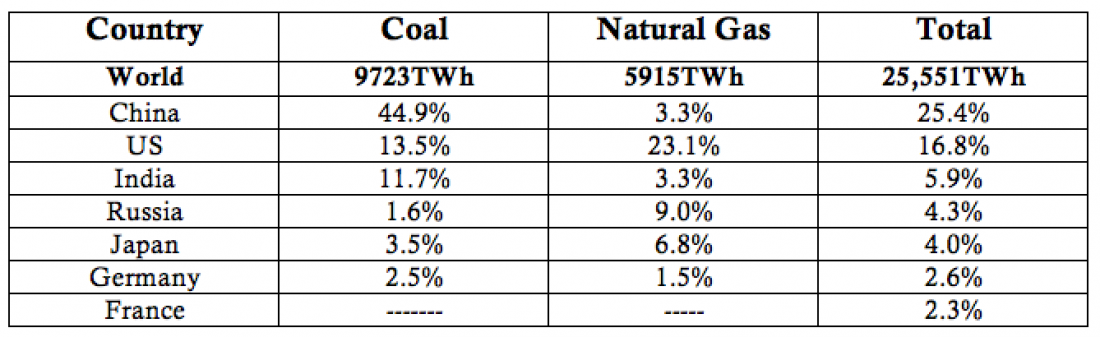
Table 2 below shows that use of 70% of world coal is concentrated in China, the US, and India. As last week’s blog showed, China and the US are two of the largest producers of electric vehicles. France gets more than 90% of its electricity from carbon-free fuels—72% from nuclear energy and 17.8% from renewables—meaning that it only gets about 8.6% from fossil fuels. In other words, it’s an ideal place to run electric cars.
Table 2 – Percentage of coal and natural gas that 7 high-power-consuming countries use
(source: BP). The world data are given in Terawatt-hours (trillion watt-hours) the rest of the data are given as percentages of those totals.
My next blog will list the countries and cities that have announced commitments to block the sale of cars that emit carbon dioxide: no more fossil fuel-based cars. Unfortunately, the announcements have yet to include parallel commitments about changing the power sources for these cars.
I find the science behind how coal and natural gas are burned by cars and how each individual car has an impact on the environment. Unfortunately I am not sure how to convince people to switch to electric cars or enforce the ban on fossil fuel cars. Would the best way to convince people to educate them? If so, how could you do it in a way that has not been done before? Or is a ban a better and more secure option? If so, how could it be done or put in place?