Hello readers! This week’s guest blog is from Benjamin K, Quinn Downes, and Michael Guerin. Combined, we carry degrees in the fields of physics, chemistry, and biology. Through this blog post, we hope to spread information on the correlation between income inequality and carbon emissions. Although both of these factors have been extensively studied separately from one another, we utilize known information to relate the two aspects. More importantly, however, we include information on how changes in income inequality can be used to decrease carbon emissions.
Recent developments in the world’s environmental, political, and economic atmospheres have made climate change and the global widening income gap dominant topics of discussion. More of the world’s wealth is coming into the possession of fewer people while the majority of the population possesses increasingly less wealth. It is, therefore, unsurprising that there have been numerous studies done to explore how income distribution affects carbon emissions. For example, total CO2 emissions of a nation are examined alongside lognormal income distribution statistics. In this study, we analyzed data to determine if economic inequality prevalence throughout a country leads to increased carbon dioxide release as a result of excessive transport. We focused our analysis on transportation. Examining this data along with global Gini coefficient statistics, the empirical results of analysis indicate a positive correlation between a nation’s Gini coefficient and the anthropogenic CO2 emissions from all its methods of transportation. With these results, policymakers will have more insight, enabling them to make informed decisions when approaching these matters. Particularly, these findings will guide policymakers to realize that increased income equality is a possible remedy for high CO₂ emissions.
Environmental Kuznets Curve
However, to first understand the reasons as to why this analysis was necessary, we will take a look at previous models describing how GDP per capita affected the environment. In particular, during the mid-twentieth century, Simon Kuznets proposed a hypothesis stating that as economic development occurs, there is a spike in environmental degradation. As the economy continues to develop, environmental degradation reaches a peak, after which it starts to decrease. Kuznets theorized that economic inequality of a society also follows the same relation, whereby initial economic development will cause a spike in economic inequality.
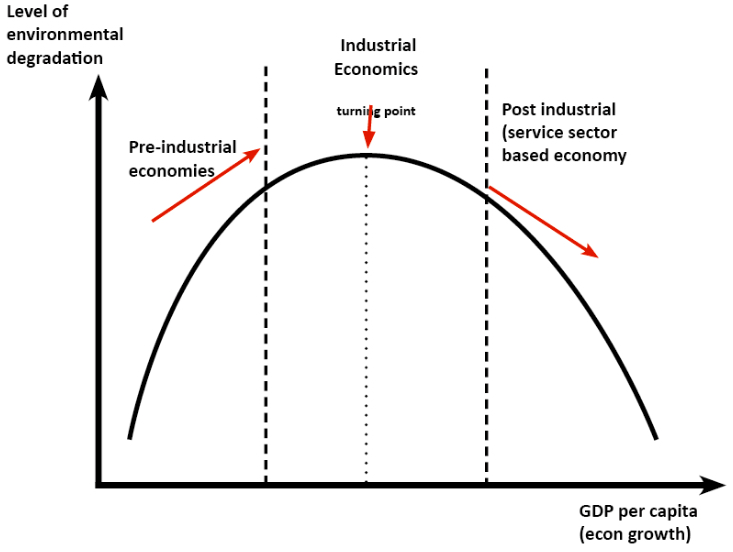 Figure 1 – Graphical representation of the relationship between a nation’s GDP per capita and its respective level of environmental degradation. This relationship demonstrates the Kuznets curve, commonly referred to as the environmental Kuznets curve when applied to this area of study.1
To put this in context, let’s consider a hypothetical undeveloped country. All of a sudden, this country is given the opportunity to invest in a business such as hospitality, because a lot of foreigners want to visit. As expected, only people with a large amount of capital can initially invest to create hotels and resorts, which they will eventually profit from. Because of this occurrence, economic inequality initially increases, since the rich will be getting richer. As more labor is needed, more people from rural areas will continue to flock towards urbanizing areas where these new hotels are located, thus keeping wages low and further increasing economic inequality. However, Kuznets continued to propose, as such industrialization proceeds, more workers will earn the area’s average income, thus decreasing economic inequality.
Unfortunately, even Kuznets himself realized that the data used for his correlation was very fragile and susceptible to error. For example, his analysis did not correlate with the economic development of most countries observed to this day. Additionally, the majority of his data compared differences in inequality and economic development of countries in Latin America, which have a record of high economic inequality, even when compared to countries of similar economic development.2 Ultimately, an abundance of such misrepresentations was able to undermine the validity of the Kuznets curve.
We now know that carbon dioxide is the main anthropogenic greenhouse gas and is believed to be responsible for the majority of global warming.3 When considering carbon dioxide as a “scale” for environmental degradation, it is incorrect to assume that carbon emissions will decrease as an economy succeeds. Due to aforementioned reasons, our study instead focuses on how other statistics can be used to more accurately correlate income inequality and carbon emissions.
Lorenz Curve
Lognormal distribution of income and the Lorenz Curve are two statistical forms used to quantify income inequality. This curve is a graphical representation of the distribution of income in an economy. The Gini coefficient is a ratio with a value between 0 (0%) and 1 (100%) that we can get from the Lorenz Curve. It can be used as a measurement of the equality of income within a population, with a value of zero expressing perfect income equality, and a value of one expressing maximum income inequality. In other words, in an economy in which every citizen earned exactly the same income, the Gini coefficient would have a value of 0. Alternatively, in an economy in which one citizen collected the entirety of the income, the Gini coefficient would have a value of 1.
The Gini coefficient should not be mistaken for a measurement of a nation’s income. It is not uncommon for high-income and low-income countries to have similar Gini values. For example, in 2016, Turkey and the United States had a Gini coefficient of roughly 0.40, yet Turkey’s GDP per capita was approximately half of that in the US.
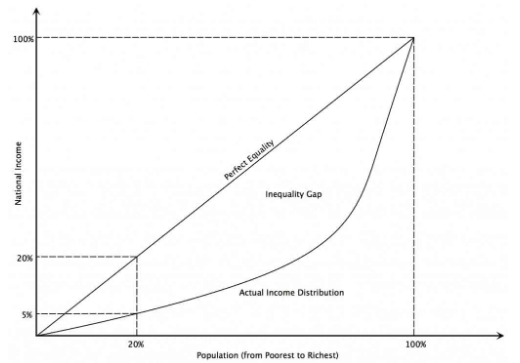
Figure 2 – Graphical representation of the relationship between a nation’s income and its GDP per capita. This relationship demonstrates a Lorenz curve and can be used to study a nation’s level of economic equality.4
This number is a representation of a ratio of the areas on the Lorenz curve, with the numerator of this ratio being the area between the actual income distribution and the perfect equality line, and the denominator being the area under the perfect equality line. The calculations for the Gini coefficient are fairly simple. If we call the region between the line of perfect equality and the Lorenz curve A, and the area below the Lorenz curve B, then the Gini coefficient can be expressed as A/(A+B). Knowing that the value of A+B is 0.5, we can express the Gini coefficient as 2A, or 1-2B. This can show us graphically that the closer the actual distribution is to perfect equality, the smaller the the inequality gap, A, and the smaller the Gini coefficient.
Data Analysis
There are many factors that affect a country’s carbon emissions. Larger countries obviously emit more carbon than smaller countries; technological advancements can lower the carbon emissions of wealthier countries while industrialization raises those of developing nations. Carbon is also emitted from many sources like cattle, electricity generation, and our focus here: transportation. This includes domestic aviation, domestic navigation, road, rail, and pipeline transport but we are not counting international aviation or international marine bunkers. To even the playing field in the data as much as possible, we plotted the percent of carbon emissions that came from the use of fuel for transportation for each country5 versus the distribution of income inequality to see if there was any significant, observable trend. This was done using the income inequality and emissions percentages per country for each year to eliminate time as a variable in consideration.
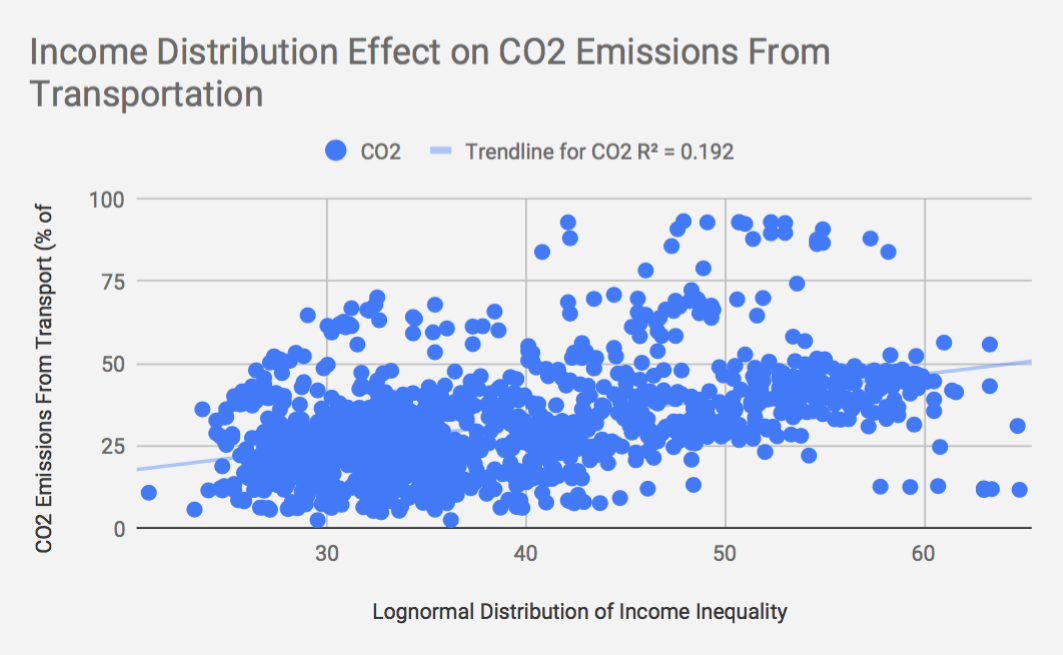
Figure 3 – Graph of the effect of income inequality on carbon emissions
From this graph we can see that there is a positive trend, meaning that there is an effect of income inequality on carbon emissions, globally. The R² value of 0.192 means that about one fifth of the variation in the emissions can be explained by the income distribution. This shows that income inequality has a definite effect on carbon emissions in a country.
Intra-Country Income Inequality Changes Versus Carbon Emission
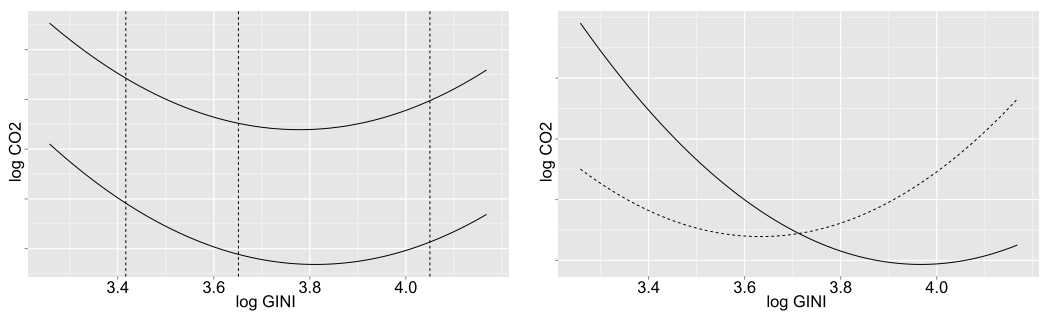
Figure 4 – Graph of how GDP of a country affects the relationship between income inequality and per capita carbon emissions6
Countries with higher GDP per capita are shown to have increased carbon emissions as well. The graph on the left represents countries in the 55th percentile (top line) and 45th percentile (bottom line) of GDP per capita. The graph clearly shows that with the higher GDP per capita there are also higher CO₂ emissions. The U shape of the graph also tells us that with high inequality, carbon emissions can be reduced by making the income distribution more equal, but that after a certain point making income distribution more equal will have the opposite effect.
In the right graph above, the solid line is for the countries with the highest GDP per capita while the dashed line is for countries with the lowest GDP per capita. This graph has been normalized so that they have the same average, so as to be easier to compare. It clearly shows that for higher GDP per capita countries, the turning point of carbon emissions tends towards higher income inequality while countries with lower GDP per capita will have lower inequality turning points.
In conclusion, this information demonstrates that higher income inequality is correlated with higher carbon emissions. However, with the goal of lowering carbon emissions, we cannot assume that lowering income inequality will accomplish this task. Rather, it is more favorable for countries with high income inequality to lower that gap country-wide, in order to see the greatest decrease in carbon emissions. If a country with already low income inequality were to lower their income inequality even further, an increase in carbon emissions is likely to arise. For this reason, we suggest that policy makers should only focus on lowering income inequality in high income-unequal nations if their goal is to observe a decrease in carbon emission.
References
- Pettinger. (2017, September 11). Economics Help. Retrieved from Economicshelp.org: www.economicshelp.org/blog/14337/environment/environmental-kuznets-curve/?fbclid=IwAR2YnKj8D_0HKSId9gSUhSe8a492NeH6dbBLIyjXf6Om5ph6jSX2StUtVmc
- Moffatt, M. (2019, April 10). Understanding Kuznets Curve: The Basis for Trickle-Down Theory. Retrieved from ThoughtCo: www.thoughtco.com/kuznets-curve-in-economics-1146122
- Ravallion, M. (2000). Carbon Emissions and Income Inequality. Oxford Economic Papers , 651-669. Retrieved from www.jstor.org/stable/3488662
- Agarwal, P. (2019, April 25). Intelligent Economist. Retrieved from Intelligenteconomist.com: https://www.intelligenteconomist.com/lorenz-curve-gini-coefficient/?fbclid=IwAR2G26tpOiKJZUofy-dTPiSYdujII1rP2ExqAHwunOHZ0YN1OW16RDWkc5c
- The World Bank Group. (2015). CO2 emissions from transport (% of total fuel combustion). Retrieved from worldbank.org: https://data.worldbank.org/indicator/en.co2.tran.zs?fbclid=IwAR3TGbo653etSMJAWl50spKfunPGom3NpwSZxbo06UzLC4yBoToT5S7sSGE
- Grunewald, N., Klasen, S., Martinez-Zarzoso, I., & Muris, C. (2017). The Trade-off Between Income Inequality and Carbon Dioxide Emissions. Retrieved from 10.1016/j.ecolecon.2017.06.034
- Bourguignon, A. (2003). The growth elasticity of poverty reduction: explaining heterogeneity across countries and time periods. Inequality and growth: Theory and policy implications , 3-26.
- Klasen, S. (2008). Economic growth and poverty reduction: measurement issues using income and non-income indicators. World Development , 36, 420-424.
- The World Bank Group. (2015). GINI index (World Bank estimate). Retrieved from worldbank.org: data.worldbank.org/indicator/SI.POV.GINI?locations=AL-AU
Your blog is so much more than just a collection of posts It’s a community of like-minded individuals spreading optimism and kindness
I often forget how interconnected issues and systems are within the United States; how addressing income inequality can help with decreasing carbon emission, even it isn’t a strong correlation. Data and findings like this help highlight how difficult it is to solve major issues, since everything is so intertwined to solve A you need to improve B, but before that you need to fix A and C. This helped me better set expectations for government officials and their policies, since there is no easy fix.
Its unfortunate how many countries the aren’t as developed as others have to suffer at the hands of the greed of those developed countries, hopefully with new administration, like in the US, we can create policies or tax reforms, that forces the hands of the greedy (the rich 1%), so that we can put money toward a greener world and close the income inequality gap.
I think inequality and climate change are tightly woven together and this data supports that, besides focusing in reducing carbon emission via reducing income inequality we should remember that these people are usually most vulnerably in many aspects in addition to climate change disadvantage.
Thank you for your post. From your data, we see that there is a slight positive correlation between countries with increased inequality having more carbon emissions. I believe that as people in the science field, we won’t really be able to change inequality in a short period of time. Even the policymakers won’t be able to reduce inequality in a short period of time. I believe a practical approach to solving this issue would be to make it more accessible for countries with lower GDP per capita to have clean energy resources. We can either do this by offering lower GDP countries clean resources at a lower price than higher GDP countries, or we could offer these countries a reward for using clean energy.
With the advancement of industrial production, the imbalance of incomes of all sectors is bound to intensify. In this case, the government, as a worker of secondary income distribution, should strengthen the protection of low-income people. At the same time, gdp is an important indicator of industrial production. If a place has a high gdp, then this place must have a certain level of industrial base. All in all, regardless of the level of income, as a part of the earth, we should also act to save energy and reduce emissions, starting from ourselves and contributing our own strength.
It is indeed obvious that it is a very unbalanced carbon emission, but this has a question worth considering. That is, financial activities are necessarily much less carbon emissions than industrial production. This is an important factor. As I have seen in a video before, an underdeveloped developing country must introduce industry for development. This is something that any developed country must experience once. We cannot simply say it. Hey, you can’t do it for the future of mankind. Therefore, developed countries must first take the lead in reducing carbon emissions and assist these developing countries to develop themselves with as little carbon emissions as possible.
That was a very informative post, thank you. I was just wondering the reason that the countries with high GDP and high inequality, like America, have higher carbon emissions, is it because they will be able to put more money into developing infrastructure and thus have better roadways and promote more driving? It would have been interesting if you offered more detail on the rational of why these connections exist. Continually, would it be possible to calculate the optimal equality level for the production of the least carbon? And if so what is that value.
Great blog. Only thing I would have liked to see is the numerical correlation coefficient based on the data you analyzed. Definitely would have offered a more concrete conclusion of your findings.
Great job guys. It is very interesting to see this curve and be able to visualize the relationship between inequality and carbon emission. Though the correlation coefficient is not strong, it is definitely relevant. I think it would be very interesting to see you guys follow up with total carbon emission per country rather than focussing on transportation. Possibly even do a follow up of carbon emission per income equality per state to see how it varies throughout the United States.