One of the fascinating things in trying to do what I do, be that teaching, writing or lecturing, is to try to anticipate long term future trends, given the ever changing present. Sometimes the present gets my full attention, and sometimes I choose to ignore it in favor of developments that might become important factors in our future. The last few weeks are no exception. We were freezing over here with the Polar Vortex; meanwhile, the best tennis players in the world have been competing in 2014’s first big tennis tournament – the Australian Open. The temperature in Melbourne reached 1110F (~ 440C). The players, the ball boys/girls and the spectators were very unhappy, but the tournament management was, for a time, dismissing the complaints. The Chief Medical Officer of the tournament was quoted as saying, “We’ve evolved in the high plains of Africa chasing antelope for eight hours under these conditions.”
Both ends of the temperature scale were blamed on climate change, with the deep freeze of the Polar Vortex to be used as the “absolute proof” that we are not experiencing global warming but instead we are going through global cooling. This stream of thought seems to come up no matter how many times scientists assert that a single weather event on either scale can never be used as a proof for or against anthropogenic (human influenced) climate change. Since I already wrote about the extreme temperature and the abundance of fires in Australia (January 14, 2013 blog) I decided that this time, I would skip the discussion of the present, and instead continue to focus on the future and population.
Jim Foreit’s wonderful guest blog last week (January 14, 2014) summarized the great success over the last 60 years in reducing both fertility rates and the growth in global population, but it ended with a less cheerful note about trying to reach a stable population over the long term. His blog ends with the following two paragraphs:
Half of the countries worldwide now have sub-replacement fertility. The downside to this trend is shrinking labor forces – a factor which has led some governments to try to reverse the course and increase fertility. Romania banned abortion, and fertility briefly increased – until illegal sources of abortion appeared to meet demand. Other countries like France and Germany in the 1930s provided families with generous incentives ranging from free childcare to cash payments for additional children, but these actions did not produce substantially higher fertility. The relaxation of China’s one-child policy may result in higher fertility, but the effects will not be known for several years.
A sub-replacement fertility world seems inevitable, with fewer productive adults supporting larger numbers of the elderly. What this will mean for human welfare will depend on both the future productivity of working adults and living the expected living standards for their parents.
I have decided to focus the next few blogs on the consequences and possible remedies to a relatively recent phenomenon: the decline of the fertility rate to below replacement rate (we call this “crossing” the fertility replacement rates), which leads to shrinking future global populations. Since, as I have mentioned before, the world population was around 2 billion when I was born, and the world was more or less functioning (remember, this was 3 months before the start of World War II), the question remaining is what issues would be associated with a shrinking world population. The UN scenario of a global population stabilizing around fertility replacement rates is not a bad scenario. The question is how we get there. The past 60 years have taught us how to move toward those numbers from high fertility rates – mainly though economic development and the use of modern contraceptives. As Jim clearly points out, we have no idea how to stabilize once global fertility has crossed below these rates.
It is not too difficult to visualize what will happen if population continues to grow. My estimation for such a scenario was that in few hundred years, with present constant population growth the world would reach the present density of Mumbai, India. This would include populating the presently completely unpopulated areas such as Antarctica and the Sahara desert.
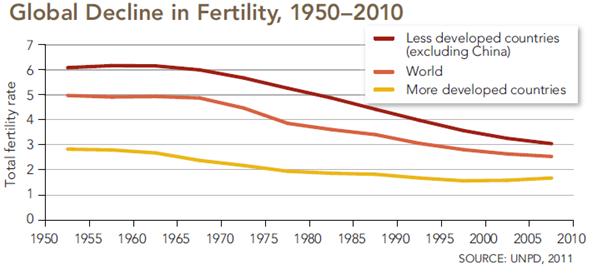 This graph, which I also used in a previous post (January 2, 2014), was originally presented in the special Science Magazine issue that was dedicated to the global population crossing the mark of 7 billion people in October 2011. It shows a sharp decline of the global fertility rate. The fertility rate in the developing countries declined from around 6 children per woman to around 3 in 2010, while that in the developed countries changed from under 3 to below 2. The fertility rate didn’t stabilize anywhere near replacement. In some countries it went as low as 1.3 – 1.4, well below replacement. As a result, the population of these countries is shrinking quickly.
As Jim mentioned, the fertility rates in about half of the world’s countries are below replacement rates. Some of these countries are well below these rates, and not all of them are rich countries. In a future blog I will show in some detail the demographic changes that took place in some of the most populous countries that crossed the barrier of replacement rates.
The key changes can be examined in terms of the two graphs below:
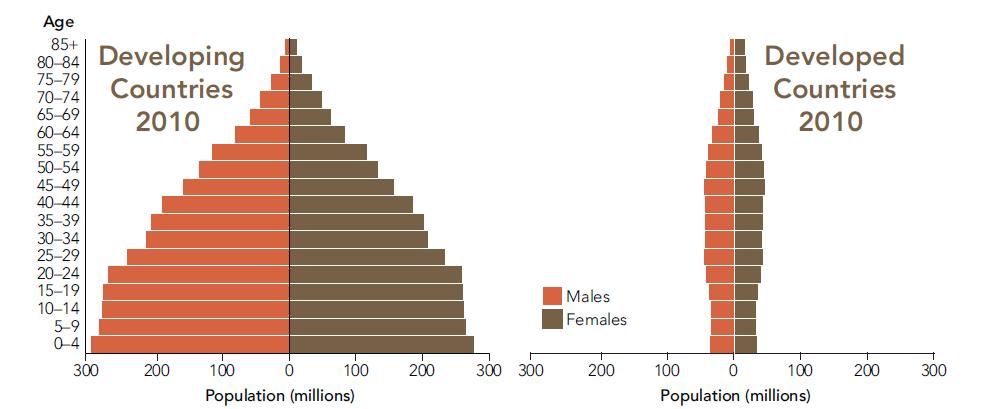

These two graphs were taken from the same 2011 Science Magazine that I mentioned before. They help give insight into Jim’s last two sentences. The first one shows what are referred to as population pyramids of developed and developing countries. These pyramids directly describe the relative numbers of the various age groups in 5-year intervals, illustrating the changes in the distribution of age groups with changing fertility rates. The second graph demonstrates one of the most direct consequences of the changes shown in the pyramids; the customary definition of working age populations includes those from 15 – 64 years old. In 2010, the highest ratio of working age adults to older adults was 17, while in the more developed countries it was down to 4, with a projected decline to 2 by mid century.
When a country or a world crosses the fertility replacement rate, it means that fewer babies are born, and with the death of the parents, the population should decrease (this is true for the global accounting but doesn’t include immigration and emigration in national accounting). As a direct result, fewer babies grow up to be part of the working age population. If at the same time, the number of older people that leave the work force grows, there are fewer working-age adults to support them. However, the process of growing up into the work force takes time: approximately one generation. In addition, other demographic transitions took effect during the last 60 years. Of these, the two most important transitions, as they closely correlate with economic development, are the much broader participation of women and the increased participation of those aged 65+ in the work force. Both transitions blur the declining ratio of working adults per non-working older adults.
In the next blog I will describe the specific cases of a few countries that have significantly crossed the fertility replacement rate. In the following blogs I will try to go into some details to fill the gaps in the UN predictions and try to outline what we need to do to get there.