Last week I focused on various localities worldwide that are taking steps to limit the use of fossil fuels through carbon pricing – either in the form of Emission Trading Systems (ETS), also known as cap and trade, or by directly taxing carbon. Carbon pricing is often a leading indicator of governments’ commitments to transitioning toward the prominent use of sustainable energy sources. Such intentions were recently put to severe testing when the price of oil and other fossils dropped by more than 50% in a very short time (it is now in an increasing trend again), while the prices of alternative energy sources stayed largely unchanged.
As I mentioned, the University of British Columbia’s Prof. Kathryn Harrison, in detailing the reasons why Canada finds itself at the bottom of the performance among the 10 largest CO2 emitters, referred to Canada as the “Fossil of the Day.” Following Prof. Harrison’s speech, a slew of reports at the Vancouver conference described British Columbia’s efforts to change that. The essence of these reports was that in spite of the country’s lag, BC is actually doing rather well. In what seems to be a battle between British Columbia and Alberta, the latter appears to be winning. Looks can be deceiving, though.
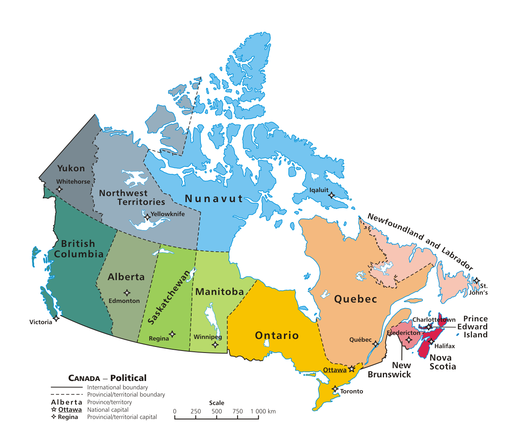
(A note to the reader: In case you’re wondering why I’m bringing Alberta into a post about British Columbia, it’s helpful to know that while the two provinces border each other, Alberta is Canada’s largest producer of oil and gas. As you can imagine, there has been a lot of back and forth about what to do with gas, oil, sustainability and the future, and it’s become quite a political issue. For instance, one large point in Alberta’s recent election was whether it was a priority to “stop Alberta’s heavy reliance on fluctuating oil prices for its revenue.”)
 Here is how Wikipedia describes the “average” citizen of Alberta:
Alberta’s per capita GDP in 2007 was by far the highest of any province in Canada at C$74,825 (approx. US$75,000). In 2006 Alberta’s per capita GDP was higher than all US states, and one of the highest figures in the world. Alberta’s per capita GDP in 2007 was 61% higher than the Canadian average of C$46,441 and more than twice that of all the Maritime provinces. In 2006, the deviation from the national average was the largest for any province in Canadian history.
All of that wealth was oil driven. Not surprisingly, citizens of Alberta cited a sharp drop in revenue from fossil fuels for the realization that the economy had to diversify. We will continue to keep an eye on the developments in the new government’s anticipated policy changes in Alberta.
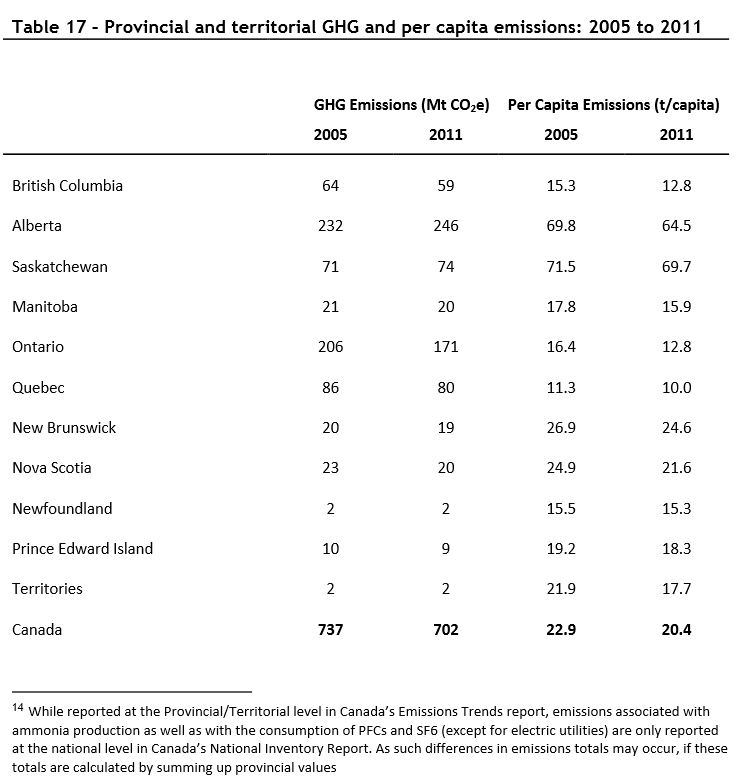
Here are the data that compare between the provinces:
 As we can see in the table above, the difference between Alberta and British Columbia in per capita emissions is a factor of 5. This marks Alberta as the “fossil” in Canada – both in terms of its commitment to antiquated technology and its continued usage of said dirty fuels.
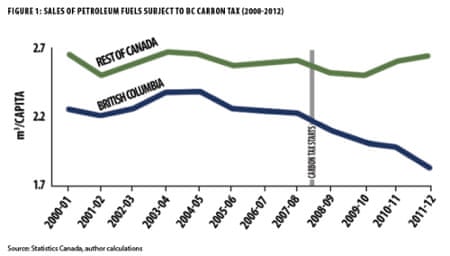
The main reason that British Columbia is ranked so high in its shift to sustainable energy sources is that it introduced a carbon tax in 2008. The tax started at a relatively low level of C$10/ton. This was intentional, as the first 5 years were intended to be a learning experience for the anticipated impacts. The plan was that the tax would gradually be raised to C$30/ton in 2012 and stay frozen at that price until 2018. The carbon tax continues to enjoy the support of the majority of the province’s citizens and the changes in the rate remain on schedule. Since the introduction of the tax, the BC economy has grown just as fast as that of the rest of Canada, while petroleum use per person is decreasing. The five years of gradual transition are already changing behavior.
Figure 1 shows petroleum sales in British Columbia as compared with the rest of Canada, before and after the introduction of the carbon tax.
 Figure 1 – Comparative sale of petroleum fuels after introduction of the carbon tax.
Sustainable energy (“Cleantech”) is the fastest growing energy sector. The tax was designed to be revenue neutral, such that the revenue would contribute to expenses usually covered by other taxes, thereby lowering tax burdens in other areas. Many regard BC’s carbon tax structure as the best designed in the world. But officials and researchers at the conference admitted that the carbon tax’s effects on shifting the weight of other taxes are still poorly understood.
The province has stated its objective is greenhouse gas reduction (2010 reference) by 80% by 2050.
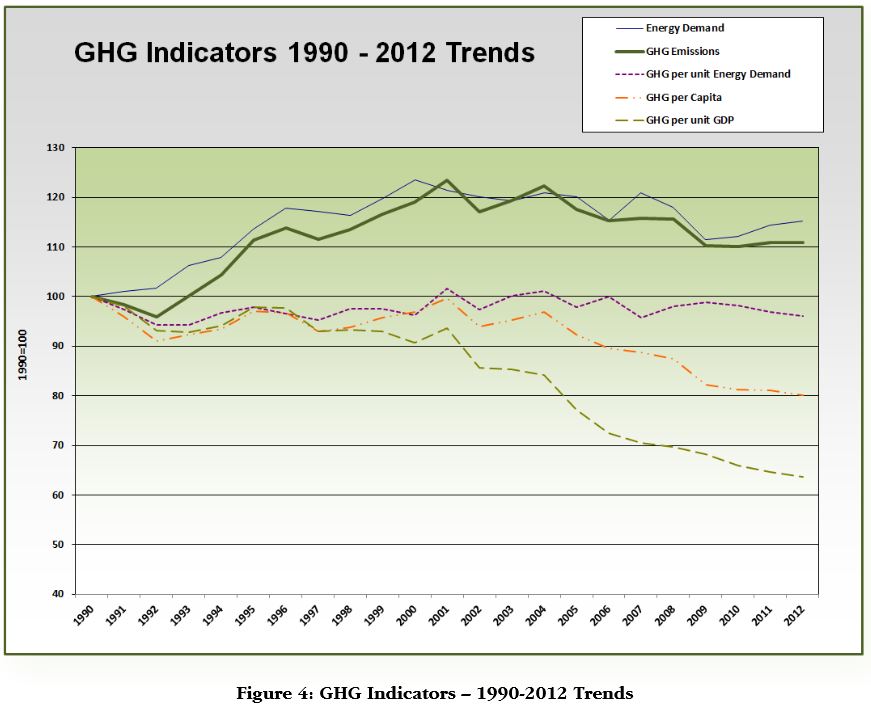
Figure 2 shows how British Columbia is actually doing.
Greenhouse gas emission and energy use, two extensive parameters that strongly depend on population and economic development, peaked around the beginning of the century and have been on a mild decreasing pattern since. Over the “learning” period of the carbon tax (2008 – 2012) they remained approximately constant. The greenhouse gas emission per unit of energy demand is an intensive parameter that depends primarily on the mixture of energy that is being used. This parameter remained approximately constant from 1990. There is no indication from this data that the energy mix that BC is using changed because of the implementation of the carbon tax. The two other intensive parameters, emission per capita and emission per unit of GDP show decrease in various rates from about 2000, well before the introduction of the carbon tax.
Figure 3 shows the trends in carbon emission per capita of some of the other major global emitters. The two global emitters that can be compared to Canada – the United States (which has no carbon pricing) and the European Union (whose carbon pricing is still a work in progress) – show similar trends to that of British Columbia.
As the data below show, the use of carbon pricing to help mitigate climate change by influencing our use of different sources of energy is still a work in progress.
 Figure 2 – Greenhouse gas emission and energy use in British Columbia
 Figure 3 – Carbon dioxide emission per capita of major global emitters.

Regarding provinces like British Columbia and Alberta, and oil producing countries in general, I think we have to be REALISTIC! Oil and gas and/or coal is big business in these areas, and that’s how the people in those places make their money! There is an old saying, “Money makes the world go ;round”. The people of those places are not going to stop oil and gas drilling and refining just for the environmentalists! That is their LIVELIHOOD!
I n the U.S. about 150 years ago, a bloody war was fought over money—the civil war! Things like slavery was a big part of it too, but the main route of all the evil was MONEY! So if we think we can convince people and governments that make a lot of money from oil and gas production and refining to stop or greatly cut it back, we should get realistic and THINK AGAIN!