Table 5.1 of the 2016 National Academy’s Attribution of Extreme Weather Events in the Context of Climate Change (described in my October 11th blog), grades our knowledge of attributions of extreme climate events.
The table summarizes the assessment of the state of event distributions for different event types in terms of three criteria: capabilities of climate models, quality and length of observational records, and understanding of the physical mechanisms that connect the event with climate change.
The capabilities of climate modeling and understanding of the physical mechanisms of wildfires are low; the quality and length of their observational records are medium. Floods don’t show up on the table but events that contribute to them do. These include extreme rainfall, snow and ice melting, and tropical and extratropical storms. Measuring capabilities in these events vary between low and medium, using the same criteria.
Fires and floods attract the most media attention and students that want to practice assigning climate change attributions usually try their hand at these two.
Two paragraphs on fires in the National Academy report summarize some aspects of this assessment:
Although wildfires are not meteorological events, their likelihood and extent can be influenced by climatic factors. Wildfires are often large and rapidly spreading fires affecting forests, shrub areas, and/or grasslands. Wildfires occur in many areas of the world, especially those with extensive forests and grasslands (Romero-Lankao et al., 2014). While most wildfires are started by lightning, a substantial number are started by humans, especially near populated areas. The most common metric of wildfires is the area burned, either by a single wildfire or by all wildfires during a fire season in a particular region.
Climate warming has resulted in longer fire seasons, consistent with the recent observed increase in severe fire years in the western United States and Alaska, as well as Brazil, eastern Africa, and parts of Eurasia (Jolly et al., 2015). What is less clear is how climate warming is driving changes in the atmospheric circulation and its teleconnections, resulting in persistent areas of high pressure that lead to large fire years on regional scales. Similarly, it is unclear how climate warming is regulating the shorter-term weather patterns that control extreme fire periods during which fires expand rapidly. Counterfactual model experiments are needed to address the role of climate warming in severe fire years regionally and in shorter episodes of rapid-fire expansion.
From this, I understand that the emphasis here remains on how wildfires start: whether the fire can be attributed to either humans or lightning. Figure 1, constructed by Visual Capitalist, provides a graphic of data on the starts of extreme fires in the US over the last 20 years:
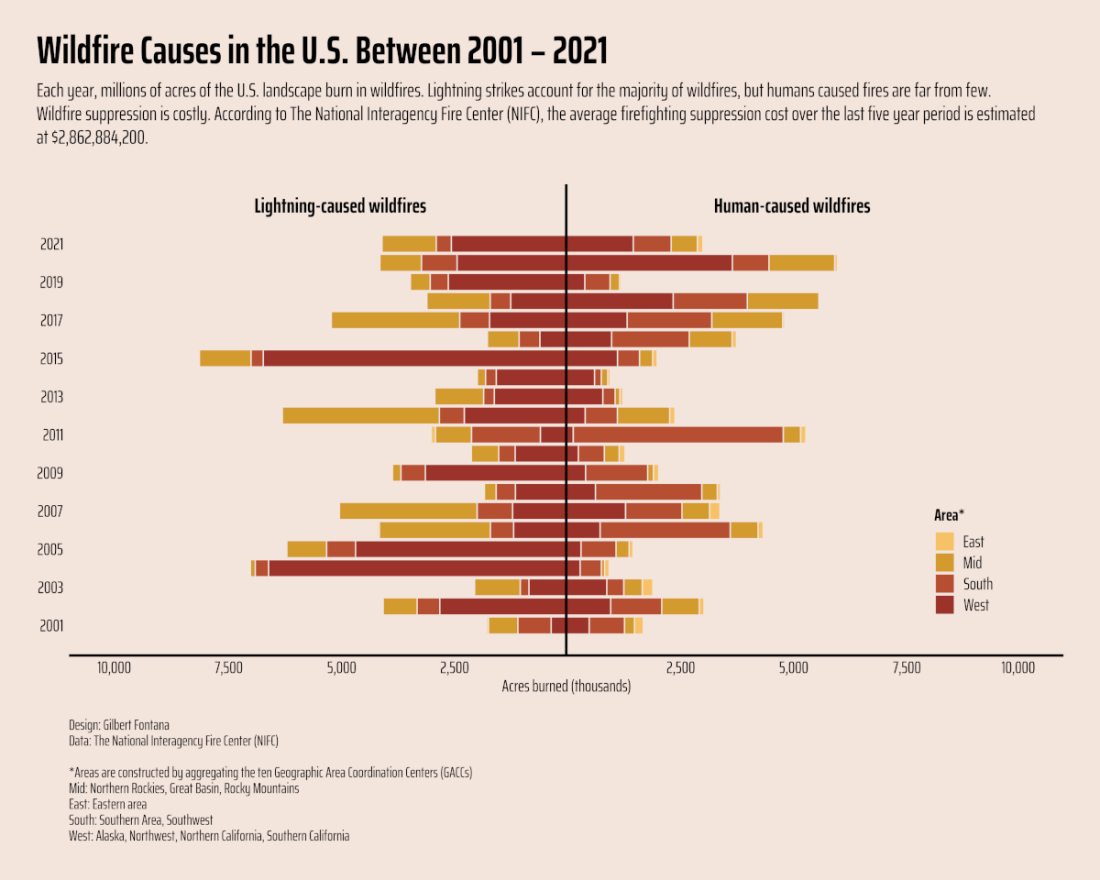
Figure 1 – Wildfire attributions in the US over the last 20 years, with lightning on the left and humans on the right (Source: Visual Capitalist)
The association between how the fires start and attributions contradicts the argument that I made in last week’s blog that initial conditions and attributions are separate actions.
The capability of modeling wildfires, as a test for attribution, according to the National Academy, was low. However, that National Academy report was published in 2016. Below is a Wikipedia entry, last edited in 2022, on the same topic:
Wildfire modeling attempts to reproduce fire behavior, such as how quickly the fire spreads, in which direction, how much heat it generates. A key input to behavior modeling is the Fuel Model, or type of fuel, through which the fire is burning. Behavior modeling can also include whether the fire transitions from the surface (a “surface fire”) to the tree crowns (a “crown fire”), as well as extreme fire behavior including rapid rates of spread, fire whirls, and tall well-developed convection columns. Fire modeling also attempts to estimate fire effects, such as the ecological and hydrological effects of the fire, fuel consumption, tree mortality, and amount and rate of smoke produced.
Wildland fire behavior is affected by weather, fuel characteristics, and topography.
Weather influences fire through wind and moisture. Wind increases the fire spread in the wind direction, higher temperature makes the fire burn faster, while higher relative humidity, and precipitation (rain or snow) may slow it down or extinguish it altogether. Weather involving fast wind changes can be particularly dangerous, since they can suddenly change the fire direction and behavior. Such weather includes cold fronts, foehn winds, thunderstorm downdrafts, sea and land breeze, and diurnal slope winds.
Wildfire fuel includes grass, wood, and anything else that can burn. Small dry twigs burn faster while large logs burn slower; dry fuel ignites more easily and burns faster than wet fuel.
It has long been recognized that “fires create their own weather.” That is, the heat and moisture created by the fire feed back into the atmosphere, creating intense winds that drive the fire behavior. The heat produced by the wildfire changes the temperature of the atmosphere and creates strong updrafts, which can change the direction of surface winds. The water vapor released by the fire changes the moisture balance of the atmosphere. The water vapor can be carried away, where the latent heat stored in the vapor is released through condensation.
A schematic representation of the complexity of wildfires and their connections to climate change is shown in Figure 2:
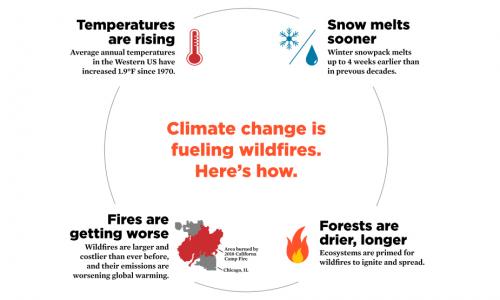
Figure 2 – Infographic of mechanisms of climate change attributions to wildfires (Source: Union of Concerned Scientists)
One of the important aspects of assessment tools for attribution of an extreme event the National Academy report mentions is the length and quality of observations of the event. Again, we turn to Visual Capitalist for a visual representation of the data over the last 30 years, shown here in Figure 3.
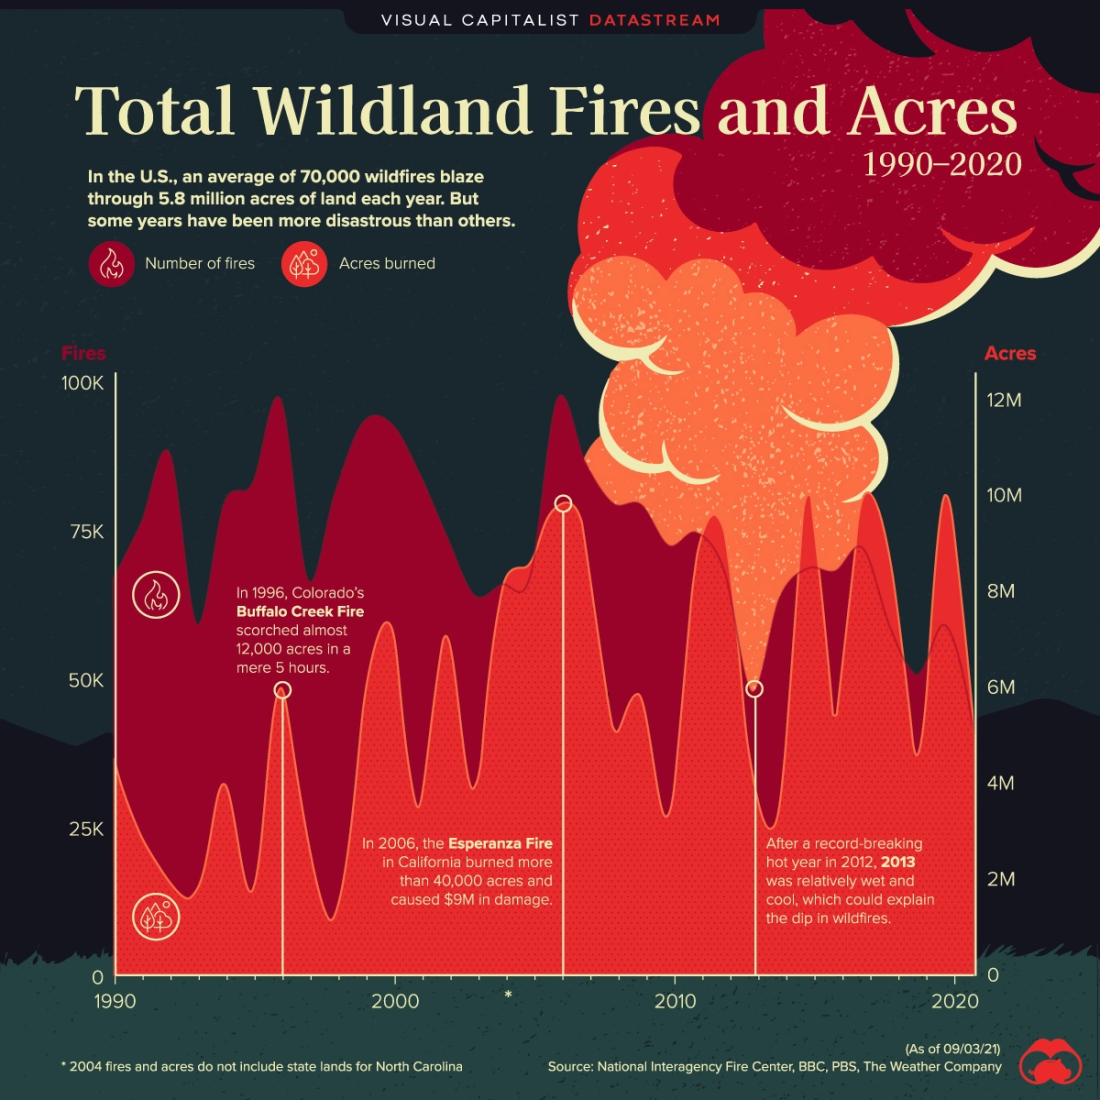 Figure 3 – Number and area of wildfires in America over the last 30 years (Source: Visual Capitalist)
A visual increase toward the later years is observed but certainly not of the same magnitude as the observed rise in temperature that I’ve described in previous blogs as resembling a hockey stick.
As I mentioned before, floods are a bit more complex than wildfires, but as we will see below (Table 1), they are also more devastating. There are now strong attempts to model individual floods and their attributions to rising temperatures. For example:
To determine how rising temperatures have altered flood risk, atmospheric scientist Pardeep Pall of the University of Oxford in the United Kingdom and his colleagues ran thousands of climate simulations. In roughly half of them, they reduced atmospheric concentrations of carbon dioxide to levels measured in the year 1900, and they adjusted ocean temperatures and the amount of Arctic sea ice—which affects high-latitude weather patterns—accordingly. In the other simulations, they modeled modern conditions. Then they compared the rainfall amounts generated in both types of simulations. Finally, they fed the rainfall values into a model that assesses the potential for flooding.
In 90% of the simulations, results suggested that the flood risk in England and Wales in autumn 2000 was at least 20% higher than it would have been in 1900. In two-thirds of the cases, the flood risk was at least 90% higher—nearly double the risk at the beginning of the 20th century.
Figure 4 shows a map of the global flood risks that the world is facing, with the progressively darker red patches representing higher levels of a population exposed to such events.
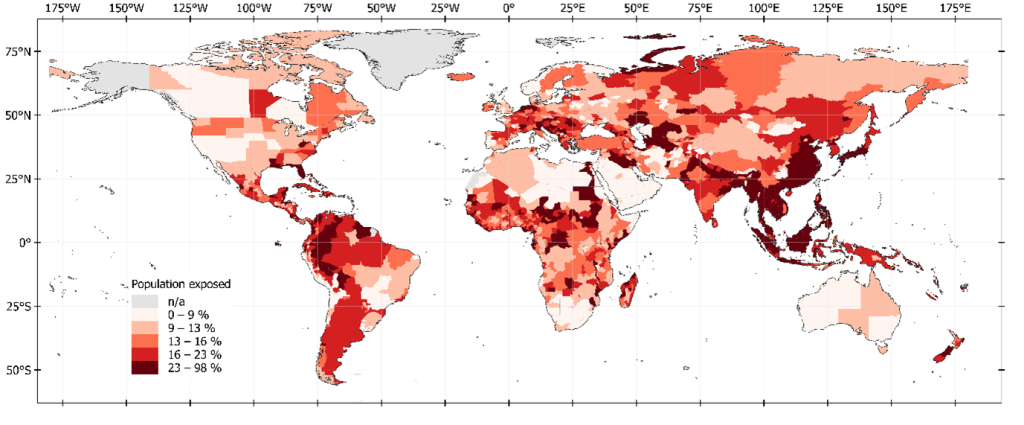
Figure 4 – Map of global flood risks (Source: World Bank)
I will end this blog with a compilation Visual Capitalist made of the number of global deaths since 2010 from global natural disasters. Obviously, floods and wildfires are major contributors to these numbers.
Table 1 – Number of deaths from global natural disasters between 2010-2019 (Source: Visual Capitalist)
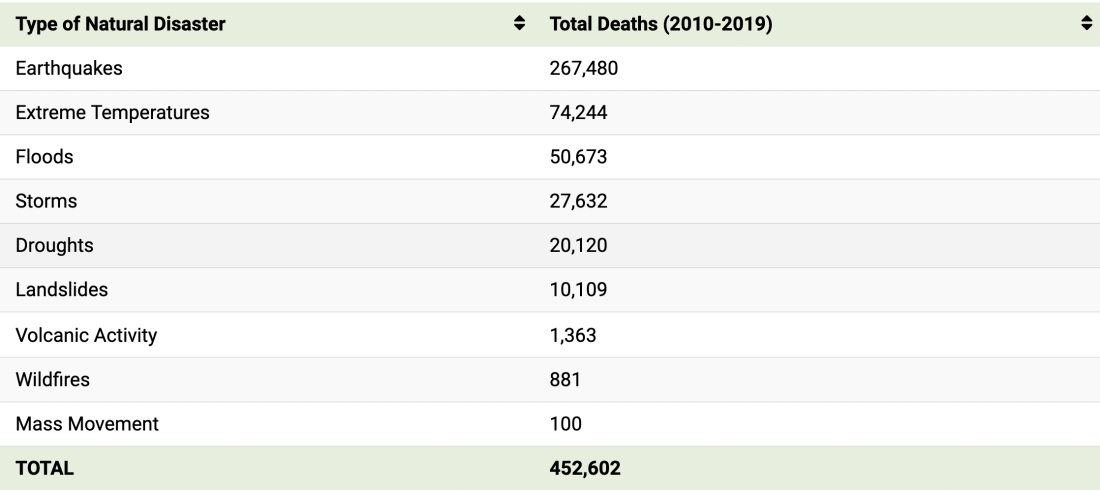
Extreme weather events are a deadly force. The question we are working on addressing is the extent to which we are making them more frequent or larger through anthropogenic climate change.
Out of all of the deaths caused by natural disasters, ones caused by global warming seem to be the one most preventable. If only we happen to address global warming much better in the long-run, we may have less deaths happening in the future.
The world is impacted by climate change. We can’t really do much to control nature. When nature calls, it just does. Us as people should do whatever it takes to keep the environment harmless rather than do human activities that just make it harmful.
Not only is global warming causing sea levels to rise creating floods, but also causing wildfires. Wildfires are caused by human and nature itself. Even if we can’t control nature and the behavior of a fire, but we should at least do what we can and reduce human activities that are harming the environment.
As seen in the diagram above, rising temperatures will trigger global climate change through melting glaciers and icebergs in the northern and southern hemispheres. Aside from that, worldwide forests will grow drier, resulting in forest fires. This would not only harm global trees but will also impact the world climate.