Previous blogs in this series (starting on March 26th) emphasized how the current global shift in electricity generation and energy supply, combined with global electrification, serves as one of the main tools for decarbonization. One key feature discussed in this series is the need to adapt the electrical grids to decarbonize the primary energy by stopping the use of fossil fuels. This means it will be necessary to enable the grids to accommodate a major increase in distributed generation of sustainable energy sources by modifying them to support bidirectional electricity flow. The shift from reliance on fossil fuels to solar energy as the primary energy source requires a shift of output of the grid from customer demand base to customer independent base (exposure to the sun). This requires a major increase in storage capabilities (see last week’s blog for examples of what happens when there is not enough storage available). Such future grids are often labeled “smart grids.” Storage aside, the present grids are already reliable; however, the modified grids will also have to be resilient to extreme climate triggers.
The issue that I started to address in the last two blogs (starting on April 23rd) is who is going to pay for all these changes. Last week’s blog tried to make the case that since electricity is becoming universal, the question of who pays is universal as well. This includes both developing countries and “rich” developed countries (where most people are not rich). Equity becomes a primary question. Last week’s blog ended with a paragraph that starts with the following line: “An unprecedented increase in clean energy spending is required to put countries on a pathway towards net-zero emissions.” The emphasis was on developing countries. The issues of the need for increased resilience and the related costs were not addressed but will be in this blog.
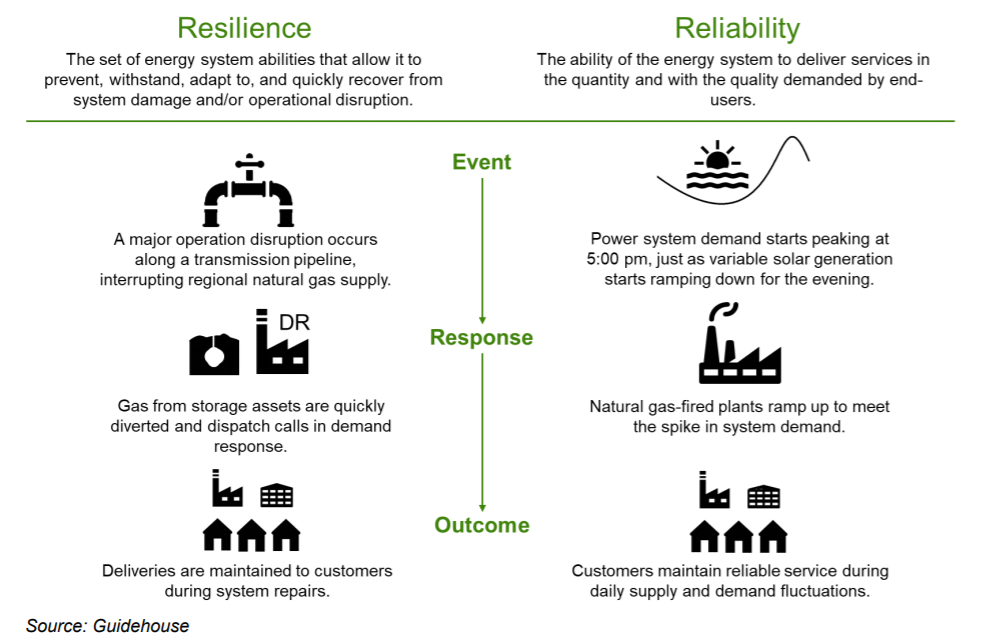
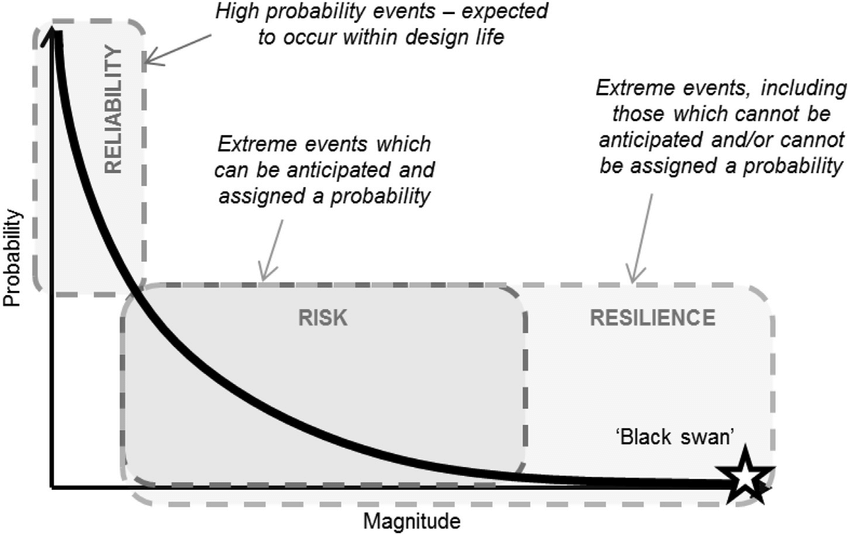
The difference between resilience and reliability needs clarification; Figures 1 and 2 should help.
As shown in Figure 1, reliability relates to expectations that power will be available on demand—whenever a customer wants it—while resilience relates to the speed of power restoration after unexpected disruptions.

Figure 1 – Definitions of resilience and reliability (Source: Energy in Depth)
As shown in Figure 2, reliability is generally related to changes in demand. Most often, these originate from common changes in consumer usage, making them highly probable and relatively predictable. In contrast, resilience has to do with cuts in power delivery; these have a much lower probability, meaning that the disruption is usually much more unpredictable.

Figure 2 – Conceptual relationships between reliability, risk, and resilience with respect to the probability and magnitude of events addressed (Source: ResearchGate)
Unpredictable disruption can be triggered by extreme climate events such as hurricanes, floods, or heatwaves, or by human disruption (whether intentional or not). Below are some examples of the two classes of triggers:
Natural
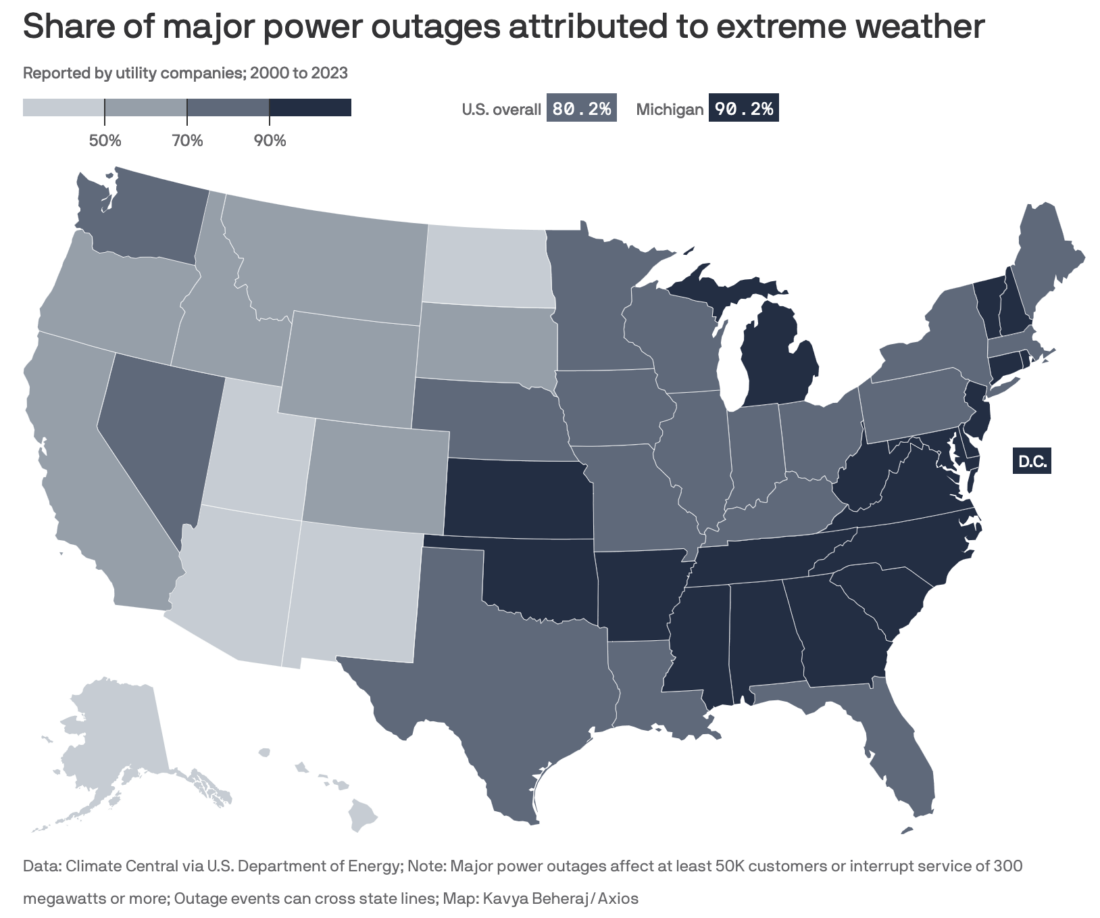
The two Axios publications given below both refer to Figure 3 from the Department of Energy, which lists the number of extreme climate events that caused major grid disruptions in the US over the last 24 years:
Zoom in: Extreme weather accounted for about 80% of all major U.S. power outages from 2000 to 2023, the nonprofit research and communications group Climate Central reports.
- Such outages are defined as affecting at least 50,000 homes or businesses, or cutting service of at least 300 megawatts.
- The majority of weather-related outages are due to severe weather like major thunderstorms, followed by winter weather and tropical storms and hurricanes.
- The report notes hurricanes can cause long-lasting outages, accounting for most of these types of outages through 2022.
The intrigue: Wildfires and heat waves, two of the hazards most clearly linked to human-caused climate change, are becoming more problematic, Climate Central found.
-
Extreme heat accounts for a smaller share of outages but creates acute public health hazards when it does occur.
-
And wildfires have accounted for about 2% of weather-related outages during this period, with more than half of these instances occurring during the past five years.
-
Climate science studies have shown that human-caused global warming is leading to larger, more intense wildfires. In addition, wildfire seasons are getting longer across the U.S. and Canada.
-
Some of these outages were preemptive safety shut-offs by utilities to try to avoid sparking a blaze on days with extreme fire weather conditions.
 Figure 3 – Share of major power outages attributed to extreme weather
(Data: Climate Central via U.S. Department of Energy; Note: Major power outages affect at least 50k customers or interrupt service of 300 megawatts or more; Outage events can cross state lines; Map: Kavya Beheraj/Axios)
We can see that in comparison with the US overall average of 80.2%, the largest areas with the most prevalent outages (>90%) attributed to extreme weather are on the Southeast Coast and in the South. However, the state that is the exception to these trends is Michigan.
Michigan is a national outlier for its number of major power outages since 2000, a new report from nonprofit research and communications group Climate Central found.
Why it matters: Electricity outages will become more common as extreme weather events — many driven by climate change — wreak havoc on the country’s aging power infrastructure.
- Outages and lengthy restoration times can cost the economy billions of dollars.
The big picture: While the South and Southeast have experienced the most extreme weather-related power outages during the past two decades, Michigan (174) has experienced more major power outages than any state other than Texas (264).
- 2% of the local outages were attributed to extreme weather, while southern states like Alabama and Georgia blame outages on extreme weather nearly 99% of the time.
The intrigue: The states with the most reported weather-related significant power outages during the 23-year time frame were Texas, Michigan, California, North Carolina and Ohio, according to the report.
-
Researchers found that long-duration outages, which most frequently affected socially and medically vulnerable populations, tended to occur in Arkansas, Louisiana and Michigan.
KYIV, April 27 (Reuters) – Russian missiles pounded power facilities in central and western Ukraine on Saturday, increasing pressure on the ailing energy system as the country faces a shortage of air defenses despite a breakthrough in U.S. military aid.
The air strike, carried out with long-range missiles, including cruise missiles fired by Russian strategic bombers based in the Arctic Circle, was the fourth large-scale aerial assault targeting the power system since March 22.
There is little we can do to mitigate the second type of trigger. However, the threats of major natural triggers are increasing to a degree that they are becoming almost predictable (in other words, on Figure 2’s graph, they are moving to the left and their probability is increasing).
Can we all afford the changes to the power grids that are necessary to facilitate the energy transition? A related question is whether the global inequity in such a transition’s affordability will kill it.
One major mechanism to help equity in payment is the Loss and Damage mechanism advanced in the last two COP meetings (See November 27, 2022, blog), under which the rich countries pay developing countries for damage caused by anthropogenic climate change. However, the issue of attribution to climate change that would trigger payments is yet to be settled, as the next publication will show.
Since January, swathes of southern Africa have been suffering from a severe drought, which has destroyed crops, spread disease and caused mass hunger. But its causes have raised tough questions for the new UN fund for climate change losses.
Christopher Dabu, a priest in Lusitu parish in southern Zambia, one of the affected regions, said that because of the drought, his parishioners “have nothing”- including their staple food.
“Almost every day, there’s somebody who comes here to knock on this gate asking for mielie meal, [saying] ‘Father, I am dying of hunger’,” Dabu told Climate Home outside his church last month.
The government and some humanitarian agencies were quick to blame the lack of rain on climate change.
Zambia’s green economy minister Collins Nzovu told reporters in March, “there’s a lot of infrastructure damage as a result of climate change”. He added that the new UN-backed loss and damage fund, now being set up to help climate change victims, “must speak to this”.
But last week, scientists from the World Weather Attribution (WWA) group published a study which found that “climate change did not emerge as the significant driver” of the current drought affecting Zambia, Zimbabwe, Malawi, Angola, Mozambique and Botswana.
Instead, they concluded that the El Niño phenomenon – which occurs every few years with warming of sea surface temperatures in the eastern Pacific Ocean – was the drought’s “key driver”. They said the damage was worsened by the vulnerabilities of the countries affected, including reliance on rain-fed farming rather than irrigation.
The follow up from the oil industry indicates that we have long way to go:
Investments in the energy transition are falling way short of what is needed for its success. The fresh warning comes from BlackRock, which said annual investments in the shift away from hydrocarbons need to almost double from their current record levels. But it’s getting less likely this would ever happen.
In a new edition of its Investment Institute Transition Scenario, the bank said that moving the transition forward would require more money from both public and private sources and that, for its part, would require “alignment between government action, companies and partnerships with communities,” according to Michael Dennis, head of APAC Alternatives Strategy & Capital Markets at BlackRock, as quoted by CNBC.
BlackRock mentioned the $4-trillion figure as the necessary sum to be invested in the transition annually back in December when it released the original IITS. The amount was as impressive then as it is now, not least because it was double the amount of earlier investment estimates. What makes it even more impressive is the fact that last year’s record transition investments came in at less than half that, at $1.8 trillion.
The next blog will focus on attempts to minimize the cost of major power disruptions by differentiating grids in terms of vulnerability.
