
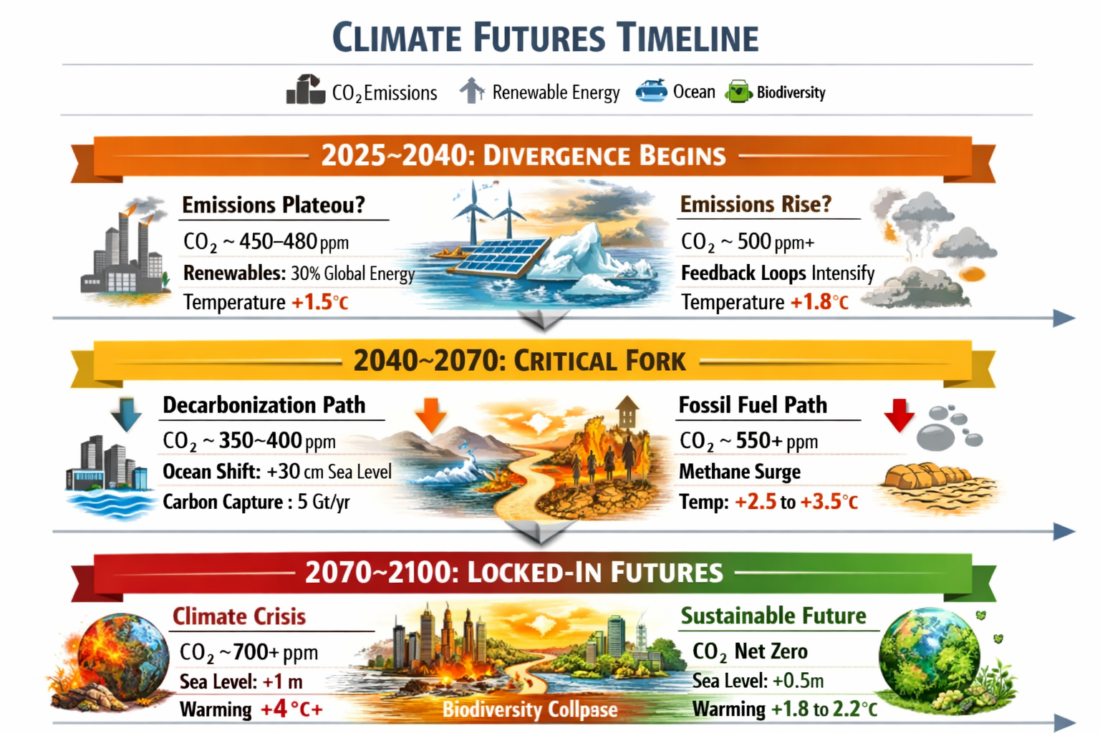
In last week’s blog, I started demonstrating the power of AI to predict aspects of the future by having it analyze the future of climate change. My focus was not to demonstrate the benefits or the accuracy of these predictions. To be honest, with my background in the topic, I did not find that the predictions added anything to my knowledge base. Nor would they help teachers that teach the topic. However, the predictions might help students and people with a minimal background in the subject. The AI that I used was Gemini, which Google has now adopted for all inquiries. Two main aspects illustrate the predictions: the top picture and the text that follows. My original question was “Can you predict the future of global climate change and explain how you arrived at these predictions?” The picture in last week’s blog came out on the first try; the text needed some feedback. My prompt from last week’s blog did not ask to emphasize humanity’s role in the process, bu it came up anyway because of AI’s exposure to IPCC training. The noticeable result in last week’s blog was that the opening picture was OK on the first trial, but the text eliminated most traces of quantitative predictions in the form of numbers to focus instead on trends. This blog is using a different AI, Copilot, which is offered as part of the Microsoft system. A short description of the two AI systems is given below (through Gemini):
Gemini is Google’s multimodal AI assistant, designed for deep web research, creative ideation, and processing vast amounts of data. Copilot is Microsoft’s productivity-focused AI, built natively into the Microsoft 365 ecosystem to streamline writing, analyze spreadsheets, and summarize meetings
In this blog, I explicitly asked Copilot to include human contributions to climate change. Unlike the previous blog, the top picture needed some fine tuning to limit the amount of information included. However, the text needed none. I started the discussion with the following question:
Can you predict the future of global climate change and explain how you arrived at these predictions? Please include human contributions.
Big picture: where the climate is headed
Global climate change will continue to intensify throughout this century. The exact amount depends on how quickly humanity cuts greenhouse gas emissions, but some patterns are very robust:
- Global temperature: Under all scenarios, global surface temperature keeps rising at least until mid‑century. Without deep emission cuts, warming is likely to exceed and then above pre‑industrial levels this century.
- Extremes and weather: More frequent and intense heatwaves, heavy rainfall, droughts in some regions, and a higher proportion of intense tropical cyclones are expected as warming increases.
- Ice, oceans, and sea level: Continued warming drives loss of Arctic sea ice, glaciers, and ice sheets, long‑term sea‑level rise, and more marine heatwaves and ocean acidification. Many of these changes are irreversible for centuries to millennia.
- Water cycle: The global water cycle becomes more intense, stronger monsoons, more severe wet and dry events, and greater variability in rainfall.
Human contribution: how much is “us”?
The scientific consensus is blunt:
- Human activities have “unequivocally” caused global warming. Burning fossil fuels, deforestation, and industrial processes have raised greenhouse gas concentrations and pushed global temperature to about above 1850–1900 levels (2011–2020 average).
- Anthropogenic forcing dominates recent changes. When scientists run climate models with human emissions, they reproduce the observed warming; without human emissions, the models show little warming. This is a key attribution test.
- Extremes already show our fingerprint. Many heatwaves, heavy rainfall events, and droughts now have a clear human‑caused component—meaning they are more likely, more intense, or both because of our emissions.
In short: the main driver of current and near‑future climate change is human greenhouse gas emissions, not natural variability or solar changes.
How scientists make these predictions
- Climate models and scenarios
- Climate models: Complex computer models simulate the atmosphere, oceans, ice, and land. They are tested against past climate and observations to ensure they can reproduce known patterns and trends.
- Emissions scenarios (e.g., SSPs): Scientists feed different futures into these models—high‑emissions, medium, and strong‑mitigation pathways. Each scenario reflects assumptions about energy use, land use, population, and policy.
- Ensembles: Many models are run together to form an “ensemble,” giving a range of possible outcomes and a sense of uncertainty rather than a single number.
- Physical understanding
- Greenhouse effect: We know from physics that increasing CO , methane, and other gases traps more heat, raising global temperature.
- Climate sensitivity: The IPCC’s best estimate is that doubling CO leads to about of warming, with a narrowed uncertainty range compared to earlier reports.
- Attribution methods
- Detection and attribution studies: Researchers compare observed trends with model simulations that include and exclude human influences, using statistical methods to quantify how much of a change is due to us versus natural variability.
What the future looks like under different human choices
- High‑emissions path (little mitigation): Warming could reach well above and potentially or more by 2100, with severe impacts on ecosystems, food systems, health, and infrastructure, plus large and continuing sea‑level rise.
- Intermediate path (current policies / NDCs): Current national pledges make it likely that will be exceeded and harder to keep warming below unless policies are strengthened significantly and quickly.
- Strong‑mitigation path (rapid deep cuts): Rapid, sustained reductions in CO and other greenhouse gases could still limit warming close to , reduce the risk of the most extreme outcomes, and slow long‑term sea‑level rise—though some changes already locked in will continue.
Bringing it together
Direct answer: The future of global climate change is largely determined by human decisions about emissions in the next few decades. Physics, observations, and models all point to continued warming, more extremes, and long‑lasting changes to oceans and ice, with human greenhouse gases as the dominant cause.
If you’d like, I can map this into a more explicit “Venn diagram” of natural variability vs. human drivers vs. future impacts to match the diagram you asked for earlier.
I followed with one more question:
Can you quantify the predictions and the scenarios?
Here’s a quantified look at the future of global climate change based on the latest IPCC Sixth Assessment Report (AR6) and related scientific literature.
🌡️ Global Temperature Projections
| Scenario (SSP Pathway) | Description | Projected Warming by 2100 (°C above 1850–1900) | Probability of Exceeding 1.5°C |
| SSP1‑1.9 | Very strong mitigation (net‑zero by ~2050) | 1.4°C (1.0–1.8°C) | ~50% |
| SSP1‑2.6 | Moderate mitigation | 1.8°C (1.3–2.4°C) | >90% |
| SSP2‑4.5 | Current policies / intermediate | 2.7°C (2.1–3.5°C) | >99% |
| SSP3‑7.0 | High emissions, regional rivalry | 3.6°C (2.8–4.6°C) | >99% |
| SSP5‑8.5 | Fossil‑fuel intensive growth | 4.4°C (3.3–5.7°C) | >99% |
Inference: Even under moderate mitigation, the world is likely to exceed 1.5°C around 2035–2040, with 2°C reached before 2060 unless emissions fall sharply.
🌊 Sea‑Level Rise
| Scenario | Global Mean Sea‑Level Rise by 2100 | Long‑term Commitment (2300) |
| SSP1‑1.9 | 0.32–0.62 m | ~0.5–1.0 m |
| SSP2‑4.5 | 0.44–0.76 m | ~1.0–2.0 m |
| SSP5‑8.5 | 0.63–1.01 m | ~2.0–5.0 m |
Drivers: Thermal expansion, glacier melt, and ice‑sheet loss (especially Greenland and West Antarctica).
🔥 Extreme Events
- Heatwaves: Frequency projected to double or triple by mid‑century under SSP2‑4.5.
- Heavy precipitation: Increase of 10–30% intensity in many mid‑latitude and tropical regions.
- Droughts: More severe in subtropical zones (Mediterranean, southwestern U.S., southern Africa).
- Tropical cyclones: Fewer overall, but stronger and more rainfall‑intense.
🌍 Human Contribution Quantified
- Anthropogenic greenhouse gases account for >90% of observed warming since 1850.
- CO₂ concentration: ~420 ppm (2026), up from 280 ppm pre‑industrial.
- Radiative forcing: Human activities add roughly +2.7 W/m² net forcing to Earth’s energy balance.
- Attribution studies: Human influence explains ~1.07°C of the 1°C observed warming (natural factors <0.1°C).
⚙️ How These Numbers Are Derived
- Model ensembles (CMIP6): Dozens of global climate models simulate physical processes under standardized scenarios.
- Observational constraints: Satellite and surface data calibrate model sensitivity.
- Probabilistic projections: Statistical methods combine model outputs to yield ranges (e.g., 5th–95th percentile).
- Attribution analysis: Compare simulations with and without human emissions to isolate anthropogenic effects.
🧭 Interpretation
-
Near‑term (2026–2040): Warming locked in at ~1.5°C regardless of scenario.
-
Mid‑century (2040–2060): Divergence begins—strong mitigation stabilizes, high‑emission accelerates.
-
End‑century (2100): Range 4–4.4°C, depending on human choices.
In real life, there is an ongoing discussion about anthropogenic contributions to the heatwaves that we are currently experiencing:
The record-breaking heat that’s scorching Europe day and night this month would not have been possible without climate change, according to a new study. The World Weather Attribution rapid study released Friday found that the heat would have been virtually impossible just five decades ago and is 200 times more likely today than it would have been 20 years ago. Millions in France, Italy, Spain, the United Kingdom and elsewhere in Europe are experiencing extreme temperatures and humidity this week associated with a heat dome. Daytime temperatures have topped 40 degrees Celsius (104 Fahrenheit) in many places, while high nighttime temperatures have also made it harder to cool down and recover.
It is obvious, that on this issue, governments are not yet using AI to improve the prospects of our future.
The post’s clear emphasis on the “attribution test”—that models with human emissions reproduce observed warming while those without do not—underscores how human activity dominates recent climate change. By highlighting this test, the article effectively links the abstract concept of anthropogenic forcing to tangible evidence, making the argument both concrete and persuasive.
Someone put together a guide to the Malfoid trend that collects the fan art, fics and even the dating sims.
The distinction between Copilot’s text needing no tuning and Gemini’s number-stripped trends is telling: AI is good at narrating robust patterns but can flatten quantitative uncertainty. The attribution test the piece cites—models reproducing warming only when human emissions are included—is the strongest teaching point, yet it still depends on scenario assumptions and observational uncertainty. For students, pairing such AI summaries with actual IPCC figures would make the human fingerprint clearer without overstating precision.
Convert any PDF to dark mode in your browser.
The distinction between using AI to structure an inquiry and using it to prove a conclusion is important here. If the predictions neither extend subject knowledge nor help classroom teaching, their value should be judged through the questions they clarify, the assumptions they expose, and the attribution they make visible. That keeps the discussion focused on evidence and accountability instead of treating a generated forecast as expertise.
The distinction between exploring a model’s outputs and treating them as instruction is important here. If the predictions neither extend subject knowledge nor give teachers a clearer way to explain the topic, their classroom value needs a more explicit case. A useful next step would be planning an activity that asks learners to inspect assumptions, uncertainty, and attribution rather than simply accept a forecast as an answer.
The distinction between generating a plausible forecast and adding genuine educational value is important here. If the predictions neither extend an informed reader’s knowledge nor help teachers explain anthropogenic climate change, their usefulness may lie elsewhere: revealing how the system organizes evidence, handles uncertainty, and attributes causes. Evaluating those planning steps could be more informative than judging the forecast alone. A useful follow-up would compare the model’s reasoning structure with established attribution methods and identify where missing context, unsupported assumptions, or excessive confidence enters the plan.
The distinction between generating predictions and improving understanding is essential here. If the stated aim is not to establish prediction accuracy, then the educational question becomes whether the output supplies usable explanations, uncertainty, or teaching structure. The article notes that the predictions did not add to the author’s knowledge base and would not help teachers, so planning should be judged against those concrete learning needs.
The comparison between Gemini and Copilot is the useful experiment here, because the failure mode you describe, dropping quantitative predictions in favour of trend language, looks like a hedging habit rather than a real model difference. Asking each one to cite an IPCC figure directly usually forces the numbers back. For classroom use I also convert these posts into short audio versions with Choicer Voicer, since students engage with them differently that way.
I particularly loved your insights into AI’s involvement in climate change planning! It’s fascinating how you highlight the importance block blast of accountability in attributions, which is typically disregarded.
The observation that the predictions added little for a knowledgeable reader—and would not materially help teachers—highlights an important distinction between fluent output and useful planning. An AI tool may restate familiar climate scenarios without clarifying causal assumptions, uncertainty, attribution, or the decisions that follow from them. A stronger evaluation would ask whether the system identifies relevant human drivers, separates established evidence from speculation, and adapts its explanation to the audience. For education, usefulness should also include teachable reasoning: students need to see why a conclusion follows, what evidence supports it, and where legitimate uncertainty remains.
The distinction between generating predictions and producing useful planning support is crucial here. If the outputs add little to an informed reader’s knowledge and offer teachers no practical value, evaluation should move beyond whether the statements sound plausible. A stronger workflow would ask the system to expose assumptions, identify causal mechanisms, compare scenarios, and show where uncertainty changes a decision. For climate education, the most useful output may not be another forecast at all, but a structured exercise that lets students examine attribution evidence, challenge model premises, and separate anthropogenic drivers from natural variability. That would make AI’s contribution testable rather than merely fluent.
The distinction between generating predictions and demonstrating their educational value is important. If the output adds little to an expert’s knowledge and offers no clear support for teachers, evaluating only fluency or plausibility misses the central issue. AI planning tools could instead be assessed through a structured rubric covering attribution logic, uncertainty, source traceability, and instructional usefulness. That would make it easier to identify whether a prediction contributes a testable insight, merely restates established knowledge, or introduces claims that require stronger evidence.