In the last few blogs (September 24 – October 8), I have tried to make the case that we can aim for a reasonable global strategy based on the IPCC SRES B1 scenario. This calls for limiting anthropogenic changes to the chemistry of the atmosphere to a degree that is manageable through adaptation. The B1 scenario is based on two fundamental anchors, both reliant on a timeline which culminates toward the end of the century: limiting and stabilizing the global population to below 10 billion people and a major transitioning of global energy toward reliance on non-fossil fuel sources, such that more than half of all global energy comes from alternative sources (up from the present 15%). I and many others, have labeled this sort of major shift in energy supply over such a short time, a “feeding transition.” Obviously, both transitions have major consequences. In our limiting and stuttering ways we are in both transitions now and many of the consequences are already visible.
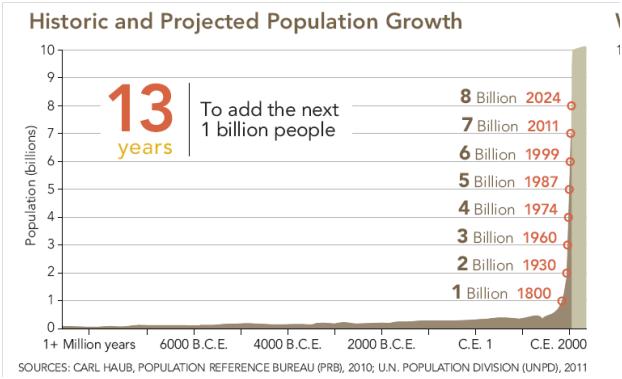
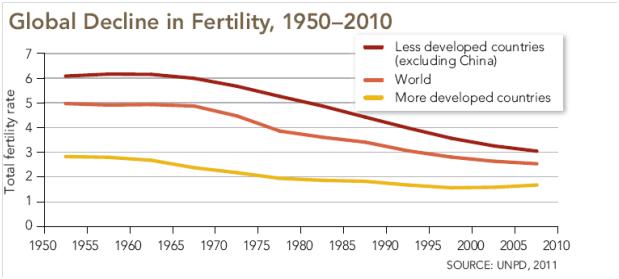
October 2011 marked a milestone, as the global population passed the 7 billion mark. Science magazine used this landmark as an opportunity to publish a full issue dedicated to present trends in global population (Science 333, 29 July 2011). Figures 1 and 2, posted below from the Science issue, are based on data from the UN Population Division.
Figure 1
Figure 1 shows the history of global population throughout human history. When I was born, the global population was just above 2 billion people. During my lifetime, the global population has grown by an additional 5 billion people; such is the power of exponential growth. Growth of this magnitude has environmental consequences, as we are now a major part of the physical environment (June 25 blog).
Figure 2 shows the more recent trends in global fertility rates, as defined by the average number of children that would be born to a woman during her lifetime. The fertility rate is the ultimate driving force for population growth, with a replacement rate taken as a number between 2 and 2.5 depending on factors such as infant mortality rate. One can see a major decrease in fertility rates after 1975. In most developed countries the total fertility rate is now well below replacement and the population is decreasing. The fertility rate in developing countries is still well above replacement but it is fast declining. This trend underlines the B1 scenario for a global population projected to stabilize below 10 billion toward the end of the century. This trend has also major consequences that we are presently experiencing, some of which I will try to explore in a future blog.
Figure 2
The part of the B1 scenario that deals with energy use is a more complicated situation. Globally, we have started to pay attention to the ways that the use of fossil fuels exert stress on the chemistry of the atmosphere. In the Rio convention (June 1992), the framework was established in an attempt to construct a global energy system that would reduce the carbon footprints while at the same time not limiting economic growth. The UN Framework Convention on Climate Change (UNFCCC) was created to form a global framework for collective action. On February 16, 2005, upon ratification by a set of countries collectively responsible for 55% of the greenhouse gases (GHG), the Kyoto Protocol came into force. Participating parties from developed countries were committed to reducing their combined GHG emissions by at least 5% from the 1990 level by the period of 2008 – 2012 and were to show significant progress in achieving that goal by 2005. The most notable exception to this ratification was the United States, which decided after the 2000 elections, not to be a part of the protocol. In contrast, the European Union was perhaps the most fervent supporter of the agreement, implementing Cap and Trade policies that shifted the cost balance between fossil fuels and alternative energy sources.
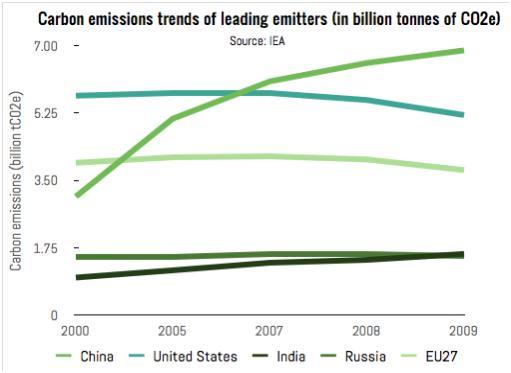
Figure 3 shows the results, as compiled from the International Energy Administration Data (EAD). From 2000 to 2009 both the European Union and the US follow similar patterns of carbon emission, while China’s emissions more than double. Looking back at the original data from the Kyoto baseline of 1990 shows that the European Union is approximately fulfilling its Kyoto commitments while the US (no commitments) slightly increases its emissions (by about 10%).
Figure 3
The emission comparison between the United States and the European Union seems to suggest that changes in government policies, as to use of energy sources, have very little impact, while economic activities certainly have an impact (two recessions over the last decade). The largest influence on the US, however, was a major shift in the primary energy source that drives electricity production.
Figure 4
Figure 4 again shows (October 8) the fuel type of electricity generation capacity by initial year of the operation of the power stations. Since 1990, and especially following the year 2000, the United States has experienced a major energy transition in the form of a shift from coal-based production to natural gas, with significant contribution from wind-fueled energy. While policy had something to do with this shift (primarily with regard to wind production), the main contributors were the market forces of price and technology. Natural gas is a fossil fuel – so it doesn’t bring us closer to the B1 energy transition, but it is the most efficient fossil fuel in terms of delivering energy for a constant carbon dioxide emission.
Figures 3 and 4 show that over the last 10 years we have experienced three major driving forces for energy use. Europe was driven by the Kyoto protocol, and China was driven by the apparent necessity to supply their fast economic growth with locally available, cost effective primary energy (coal). While the United States’ driving force was very similar to that of China, technological innovation uncovered the availability and cost effectiveness of natural gas as a much more efficient alternative to coal. The resulting energy usage happens to follow in the spirit of the Kyoto Protocol, even without having adjusted policies to accomplish this objective. Realization of the B1 scenario requires a global energy shift. If we are aiming for a similar outcome, we must somehow learn from our recent experiences as we determine how best to proceed.


Will be delighted!
Do you mind if I quote a couple of your articles as long as
I provide credit and sources back to your webpage? My website is in the very same
area of interest as yours and my users would truly benefit from
a lot of the information you present here. Please
let me know if this okay with you. Many thanks!
Wonderful blog you have here but I was curious about if you knew of any discussion boards that cover the same topics discussed here?
I’d really like to be a part of community where I
can get opinions from other knowledgeable people that share the same interest.
If you have any suggestions, please let me know. Thank you!
This is really interesting, You are an overly skilled blogger. I’ve joined your feed and look forward to seeking extra of your wonderful post. Additionally, I have shared your web site in my social networks
I wish to express appreciation to the writer just
for bailing me out of such a scenario. Because of looking through the the web and finding proposals that were
not powerful, I assumed my entire life was gone.
Living without the solutions to the difficulties you have solved as a result of this article content
is a serious case, as well as the kind that might have adversely affected my entire career if I
had not noticed your blog post. Your primary competence and kindness in touching everything was valuable.
I don’t know what I would’ve done if I hadn’t come upon
such a stuff like this. I’m able to at this point look
ahead to my future. Thanks very much for the expert and sensible
guide. I won’t think twice to recommend your web page to any individual who needs guide on
this matter.
Pingback: Stuttering Energy Transition | ClimateChangeFork