Last week’s blog looked at the separation between the rural and urban vote in the just-concluded US presidential elections. This week I will examine whether this split is a unique American phenomenon or part of the global transition as we shift towards a human-controlled environment (Anthropocene – see previous blogs).
Figure 1 clearly shows that humanity is migrating in a massive way toward cities. The ratio between global urban populations and total population is increasing sharply.
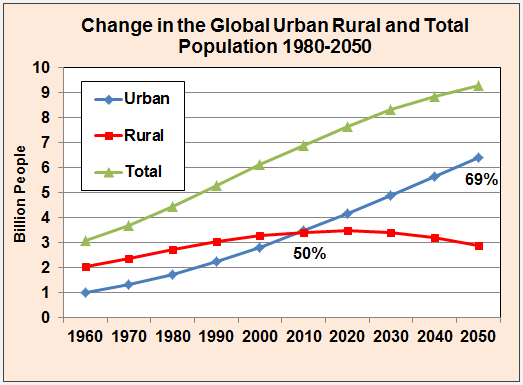 Figure 1
A recent project was able to map the history of city settlements to the purported origin of their formation nearly 6,000 years ago.

(Esri, HERE, DeLorme, MapmyIndia, ©OpenStreetMap contributors, and the GIS user community/Meredith Reba et al, Scientific Data , Nature Publishing Group)
Figure 2 – first recorded populations for all urban settlements between 3700 B.C. and 2000 A.D.
Table 1 shows the 12 most populated cities in 1975, now (2016), and as projected for 2025.
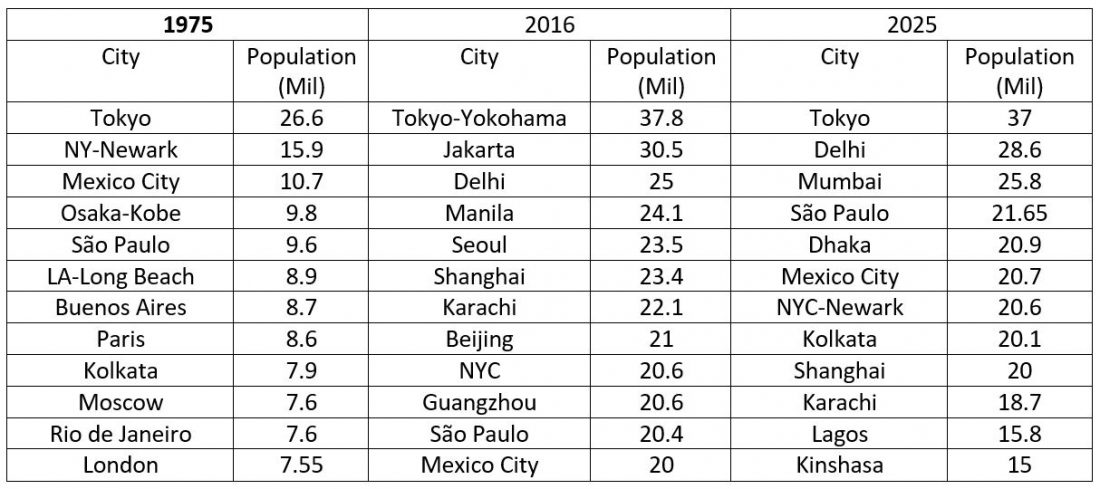
Table 1 – Population of the 12 most populated urban environments
The data for the 1975 and 2025 were taken from a special Science issue dedicated to to marking humanity’s passing the 7 billion people threshhold (Science 333, 543 (2011)); the data for 2016 were taken from WorldAtlas.
I will return to this table in upcoming blogs to discuss the future impact of climate change on sea level rise. For instance, in business as usual scenarios, most of the people who live in these cities will have to move as the majority of said cities will eventually be flooded.
For most countries, the political consequences of this population redistribution will not be immediate – due in part to their lack of a one man-one vote democratic election system. Figure 3 shows a global map of the democratic index (March 8, 2016 blog).
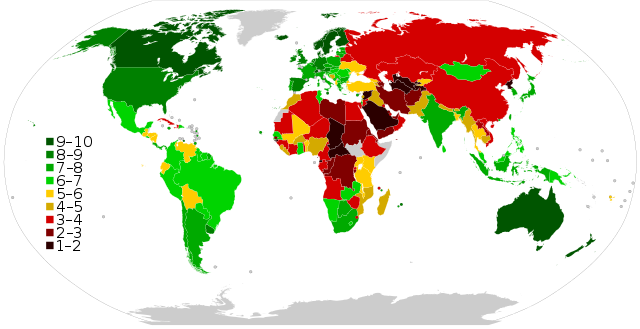
By Ternoc – Own work, CC BY-SA 4.0, https://commons.wikimedia.org/w/index.php?curid=48202088
Figure 3 – Global map of the democratic index
Many commentators tried to compare the American election’s urban/rural split to that of Great Britain’s Brexit vote (August 16, 2016 blog). Recent results show that a total of 53.4% of people in England voted to leave the EU. However, this was not reflected in its major cities, most of which voted to remain.
Of its major cities, only Birmingham voted to leave, with a tight result of 50.4% (Leave) to 49.6% (Remain). As predicted, London voted in favor of remaining, but Bristol, Liverpool, and Manchester also voted overwhelmingly in favor of remaining. The results from other cities show a clear preference for the “remain” vote as well:
Birmingham: LEAVE: 50.4% REMAIN: 49.6%
Bristol: LEAVE 38.3% REMAIN: 61.7%
Leeds: LEAVE: 49.7% REMAIN: 50.3%
Liverpool: LEAVE: 41.8% REMAIN: 58.2%
London: LEAVE: 40.1% REMAIN: 59.9%
Manchester: LEAVE: 39.6% REMAIN: 60.4%
Aberdeen city LEAVE: 38.9% REMAIN: 61.1%
Edinburgh city: LEAVE: 25.6% REMAIN: 74.4%
Glasgow city: LEAVE: 33.4% REMAIN: 66.6%
Cardiff: LEAVE: 40% REMAIN: 60%
A much more interesting case might be to examine the urban/rural split of the most recent (2014) vote in the largest democracy on the face of the earth – India. Figure 4 shows the performance of the two main national blocks: The National Democratic Alliance (NDA) led by the Bharatiya Janata Party and the United Progressive Alliance (UPA), led by India’s National Congress. In terms of parliamentary seats, it was a landslide win for the NDA (336 seats for the NDA and 58 seats for the UPA). However the rural/urban split among both the literate and illiterate electorate was considerably more balanced.
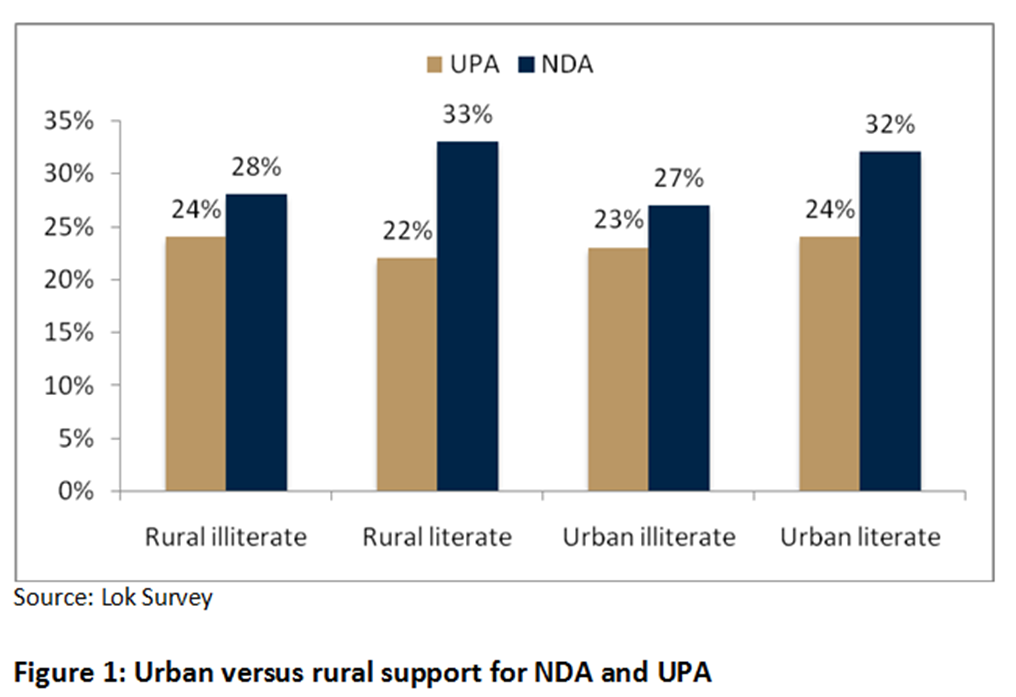 Figure 4
814 million Indians were eligible to vote and the country had a participation rate of 66.5%. India’s issues were obviously different than those of England and the US, but the common denominator was the desire for change shared by both urban and rural constituencies. One important, noticeable issue in India’s elections was the limited representation of the Muslim population. Only 22 of the 543 elected parliamentary seats went to Muslims, even though Islam is the second largest religion in India, its practitioners making up 14.2% of the population. 172 million people in India are self-declared Muslims (2011 census) yet they only got 4% of the seats. For comparison, African Americans constitute 12.2% of the US population (approximately 38 million people); within the current congressional term (the 114th US Congress), they hold 2% of the Senate (2 out of 100 seats) and 10.5% of the House of Representatives (46 out of 435 seats).
Interesting article – since you briefly comment about India’s urban-rural split and the literacy rates, I wonder if such a comparison between the literate and illiterate electorate can be made for both the United States and the UK. I also wonder what the operational definition for “literacy” is.
The disparity in political representation amongst India’s religious minorities is indeed a concerning matter because it directly affects their wellbeing and access to educational and employment opportunities. It is what sparked the Indian Muslim diaspora, of which I am a product of. Similarly, representation and protection of non-Muslim religious minorities residing in some Muslim-majority countries is a very serious concern that should be urgently addressed.