After last week’s detour, I would like to take the chance now to refocus on desalination as a possible remedy to the global fresh water stress the world is currently suffering. Here, I will discuss specific aspects of the prevalence of current usage of this technology, while my next blog will describe some of the obstacles to its wider usage worldwide.
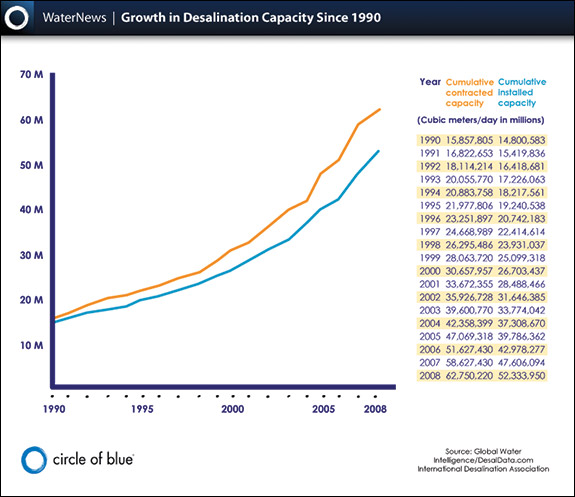
The figure below describes the growth in global desalinated cumulative installed capacity in million cubic meters/day (blue line) while the yellow line represents the growth in cumulative capacity using the same units. Following the definition of water scarcity as 1000m3 fresh water/person per year (September 24 blog), the generated additional cumulative capacity from water desalination rose from supplying fresh water to 6 million people at the threshold level of scarcity, to around 20 million people at that level. This rise represents the acceleration from around 6% increase to around 10% in more recent years. When we remember (September 3 blog) that by the UN estimates, in 2025 1800 million people will live under water stress conditions, these numbers are not very impressive, but they are a step in the right direction.
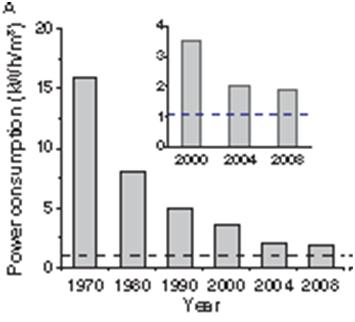
The main barrier that stands in the way of desalination becoming more prevalent is that supplementing the water cycle requires a lot of energy, as I explained in a previous blog (October 8 blog). The most cost-effective energy sources today are fossil fuels. However, cost-effective does not mean cheap, and they are also the foremost contributors to the man-made warming of the planet. To ensure success, desalinated water needs to compete with naturally available fresh water. Progress is being made on this front as well. The figure below (Menahem Elimelech and William A. Phillip; “The Future of Seawater Desalination: Energy, Technology and the Environment”, Science, 333, 712 (2011)) shows the evolution of the power consumption required for desalination since 1970. The horizontal dashed line corresponds to the theoretical minimum energy required for desalination of 35g/liter sea water at 50% recovery. Technology is making great progress in approaching this line.
One of the most beneficial results of this reduced energy requirement is the sharp reduction in price that is shown in the figure below for facilities in various countries and some further details in facilities in the US. However, prices are a soft number that one should approach with some care because they vary with the size of the plants and the price of the available energy. Even so, the trend toward lower prices is unmistakable.
 The map below shows the “hot spots” for the use of this technology. Unfortunately, the height of the bars is not normalized to any parameter that scales with the size of the country (population, GDP or water consumption) so the visual might be a bit misleading. For obvious reasons (abundance of oil money, great shortage of water) South Arabia and the Gulf States are leading the effort. The effort is visible in almost every continent but, as is so often the case with activities in which available money plays an important role, it is dominated not necessarily by need, but rather, by the ability to allocate the necessary resources.
 In future blogs, I intend to elaborate upon the other impediments that stand in the way of desalination becoming a more prominently used solution to water stress; some of these obstacles come from unexpected sources.


