The test of any major transition is in its response to a sharp perturbation. Often such disturbances come in the form of a major war. Fortunately, the present global energy transition is being tested in a much more peaceful manner. As I have mentioned in previous blogs, economics have been the main driving force behind a successful transition from fossil-fuel-dominated energy sources to sustainable ones that do not result in carbon emissions. Attempts to make sustainable energy sources competitive with fossil fuels focused in large part on making the sustainable energy sources price competitive with fossil fuels. These attempts were trying to either make fossil fuels more expensive through instruments such as carbon tax or cap and trade or to lean in the other direction, making the sustainable energy sources cheaper through subsidies of one form or another. In the summer of 2014 a major trend started to shake the marketplace as it disrupted the balance between supply and demand. Prices of fossil fuels dropped by more than 50% in 6 months or so. I have discussed this sharp decline before (see my January 13, 2015 blog) and showed an earlier version of the figure below to demonstrate the price changes
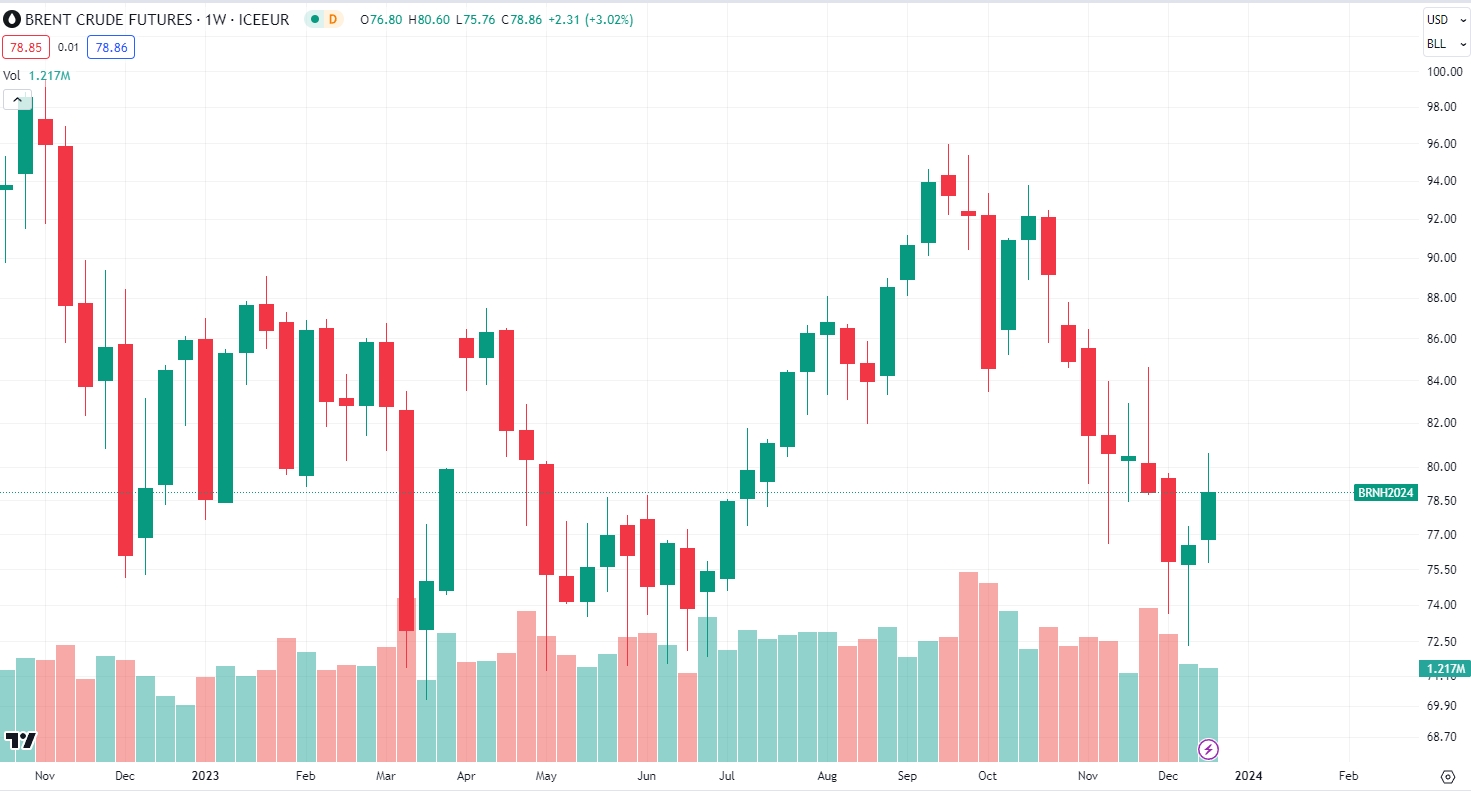 Figure 1 – Recent price change in crude oil
The price of Crude Oil Brent reached below $50 a barrel in January, and has risen to the mid-$60 range now – that’s a climb of about 30% but is still more than 40% below its peak at the beginning of 2014. The January blog came a bit too early to investigate the effects of the price drop; initial reports about possible impacts are just now coming in.
One of the most informative new pieces of data on global energy use is the annual BP (British Petroleum) Statistical Review of World Energy. The 2015 report just came out and among its key findings is a comparative summary of global energy consumption growth in 2014 (shown in Figure 2).
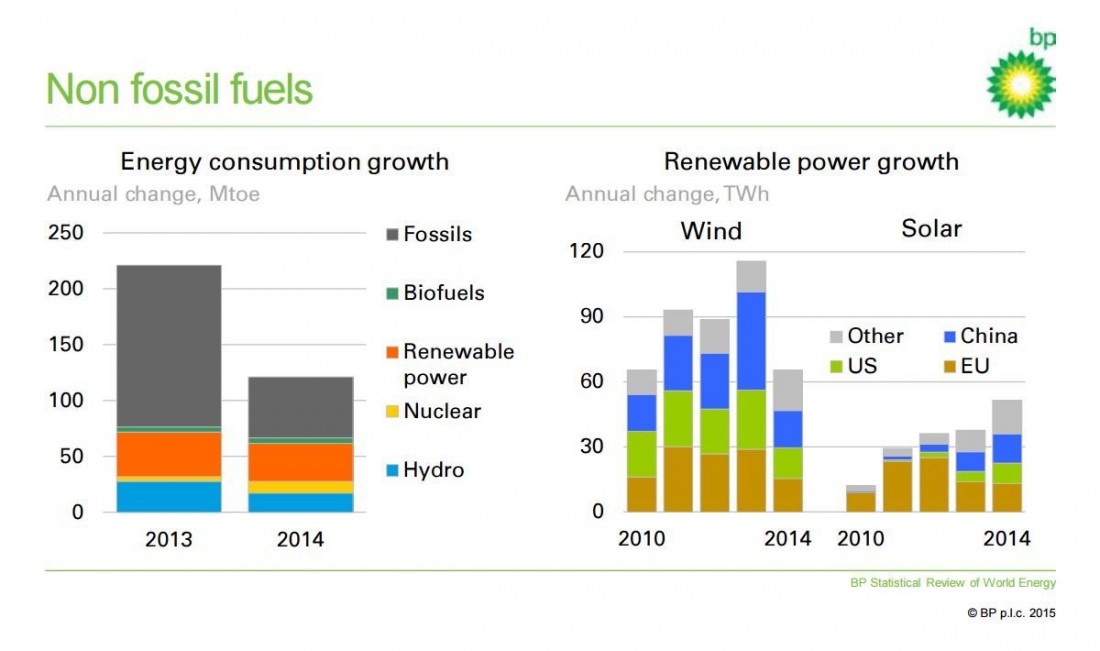 Figure 2 – Global Energy Consumption and Renewable Energy Growth in 2014
The figure on the left demonstrates a marked decrease of fossil fuel use in 2014, with little or no decrease in renewable power. The figure on the right, meanwhile, depicts the recent changes that have been taking place in renewable power, including a decreasing usage of wind energy and an increase in the use of solar (in this case meaning photovoltaic because wind, biofuels and hydro are also solar-derived energy sources).
A direct comparison and breakdown of the 2014 installation of photovoltaics devices in the US is shown in Figure 3.
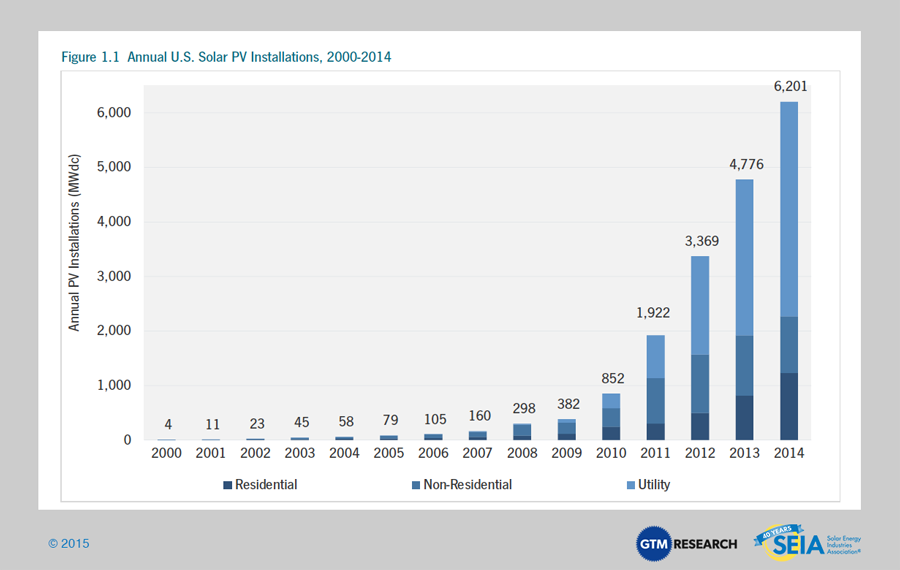 Figure 3 – Annual U.S. Solar PV Installations 2000-2014 Q4
Unfortunately, not everything in the picture is bright and cheery. Some expected negative impacts are also being reported. The aptly named Justin Doom (Bloomberg) reports a 15% drop in clean energy spending which is has already reached the lowest level since 2013:
About $50.5 billion was invested in the first three months of 2015, the least since the first quarter of 2013 when spending on clean energy totaled $43.1 billion, according to research released Friday by Bloomberg New Energy Finance. The figure a year earlier was $59.3 billion.
Lawrence Ultrich of the New York Times likewise reports a significant drop in purchase of gasoline saving vehicles such as hybrids and electric cars:
In all, 55 percent of hybrid and electric vehicle owners are defecting to a gasoline-only model at trade-in time — the lowest level of hybrid loyalty since Edmunds.com began tracking such transactions in 2011. More than one in five are switching to a conventional sport utility vehicle, nearly double the rate of three years ago.
Predictions for future trends are difficult. The supply-demand balance in fossil fuels is presently resisting significant changes, so a return to $100 or so per barrel seems unlikely in the foreseeable future. Additional midterm and longer term impacts will become more visible with time. Stay tuned.
I agree, I believe not only how cheep gasoline running vehicle are, but how expensive electric ones are both play a role in the consumption of oil. Hopefully with there new leadership in America we can be able to use the new tax reforms created, or could be created, to help minimize the use of fossil fuels.