Myles Allen, one of the pioneers of the emerging science of determining how we attribute extreme climate events to humans, featured prominently in a Scientific American piece earlier this month:
But the radio voice added that it would be “impossible to attribute this particular event [floods in southern England] to past emissions of greenhouse gases,” said Allen in a commentary published in Nature shortly thereafter.
In 2003, that was the predominant view in the scientific community: While climate change surely has a significant effect on the weather, there was no way to determine its exact influence on any individual event. There are just too many other factors affecting the weather, including all sorts of natural climate variations.
His hunch held true. Nearly 15 years later, extreme event attribution not only is possible, but is one of the most rapidly expanding subfields of climate science.
The Bulletin of the American Meteorological Society now issues a special report each year assessing the impact of climate change on the previous year’s extreme events. Interest in the field has grown so much that the National Academy of Sciences released an in-depth report last year evaluating the current state of the science and providing recommendations for its improvement.
In 2004, he and Oxford colleague Daithi Stone and Peter Stott of the Met Office co-authored a report that is widely regarded as the world’s first extreme event attribution study. The paper, which examined the contribution of climate change to a severe European heat wave in 2003—an event which may have caused tens of thousands of deaths across the continent—concluded that “it is very likely that human influence has at least doubled the risk of a heat wave exceeding this threshold magnitude.”
The breakthrough paper took the existing science a step further. Using a climate model, the researchers compared simulations accounting for climate change with scenarios in which human-caused global warming did not exist. They found that the influence of climate change roughly doubled the risk of an individual heat wave. The key to the breakthrough was framing the question in the right way—not asking whether climate change “caused” the event, but how much it might have affected the risk of it occurring at all.
It is much easier to determine how humans have contributed to global climate change. Specific local weather event attribution requires in-depth examinations of driving forces in a particular location at a particular time, as well as an attempt to determine how to describe a system that fits within a global structure.
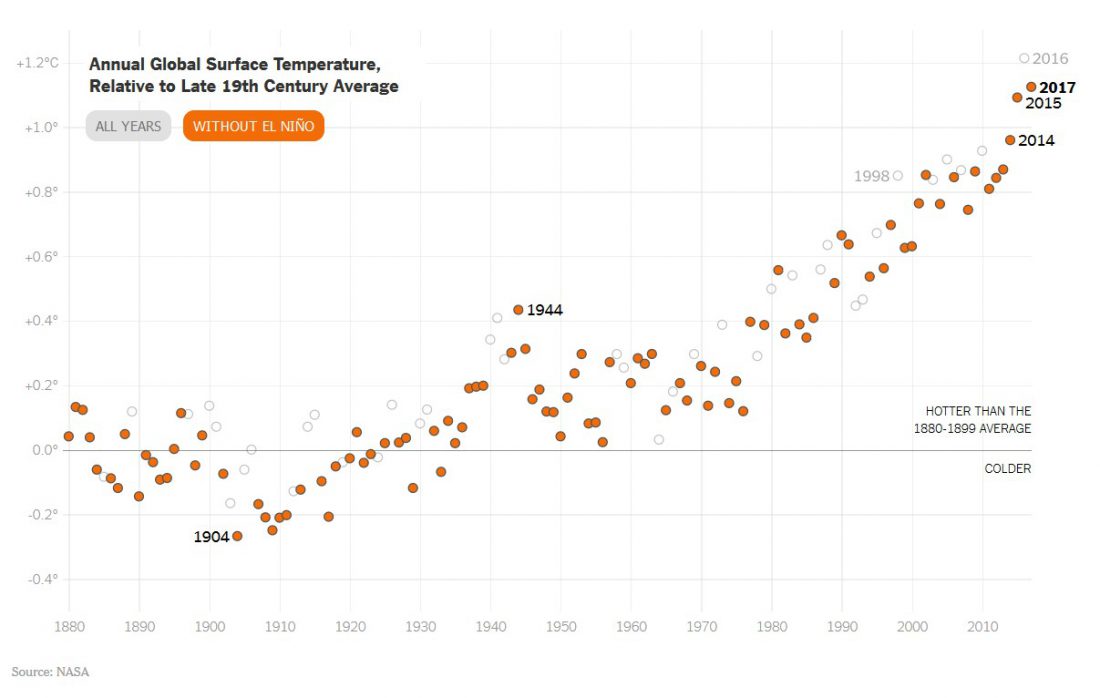 Figure 1 – Average yearly global temperature with (empty circles) and without (full circles) El Niño Southern Oscillations
Figure 1 describes average global temperature changes from 1880 until now. It also distinguishes between years that experienced El Niño Southern Oscillations and years that didn’t. On a global scale, the trend in both categories follows the same pattern. This is obviously not necessarily true on the local scale. Indeed, many of the papers that try to describe weather on a local scale incorporate the estimated extent of the El Niño impact. The figure emphasizes that – global or local – one of the best ways to determine attribution for a particular weather event is to try to identify a multi-year pattern in which one can distinguish the presence or absence of a particular driving force.
I discussed Figure 2 in an earlier blog (October 3, 2017) in the context of global attribution and as we will see below, it is currently the main tool being used to determine local weather event attributions. Figure 2 clearly shows the measured and calculated anomaly between human-influenced temperature and that without human influence.
Such a combination of superimposing observational data with and without human influence is now the cornerstone in determining human contributions to any extreme weather event.
 Figure 2 – Global warming attributions – simulation of 20th century global mean temperatures (with and without human influences) compared to observations (NASA)
Figure 3 shows the driving forces being shown in climate simulations, as taken from the most recent National Climate Assessment Report (August 15, 2017 blog). For the first time in the history of the report, this edition includes a full chapter on climate event attribution (Chapter 3).
The human attributions are included among sections of the gray box labeled “climate forcing agents.”
Once the simulations fit the measured results as they do in Figure 2, one can choose particular sections of interest within that gray box. In Figure 2, this is done using “human influence,” a broad term that includes CO2, non CO2 greenhouse gases, aerosols and land use.
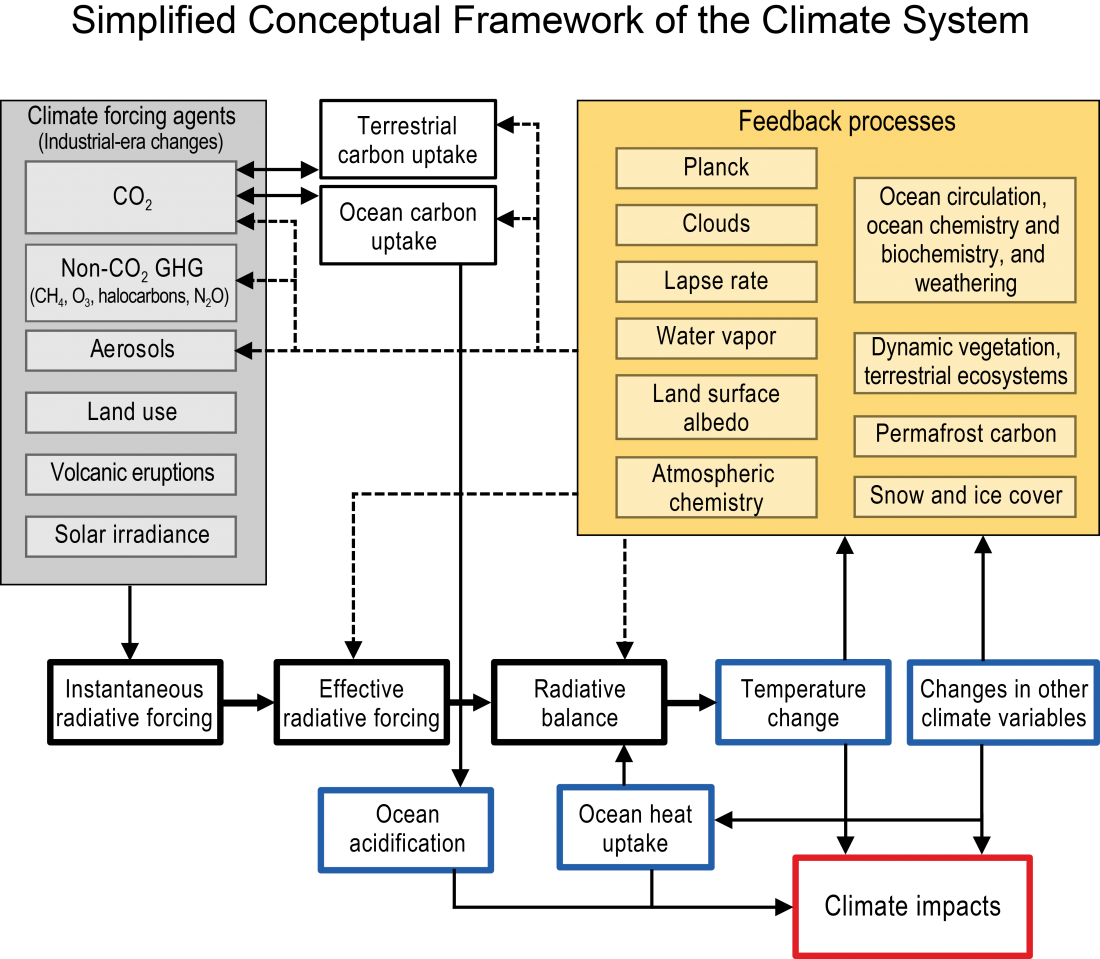 Figure 3 – Simplified conceptual modeling framework for the climate system as implemented in many climate systems (CSSR 4th National Climate Assessment Chapter 2)
The PRECIS model is a great example of a relatively simple model that was adopted to determine specific contributions to weather and climate events:
PRECIS is a regional climate model (RCM) ported to run on a Linux PC with a simple user interface, so that experiments can easily be set up over any region of the globe. PRECIS is designed for researchers (with a focus on developing countries) to construct high-resolution climate change scenarios for their region of interest. These scenarios can be used in impact, vulnerability and adaptation studies, and to aid in the preparation of National Communications, as required under Articles 4.1 and 4.8 of the United Nations Framework Convention on Climate Change (UNFCCC).[1]
The American Meteorological Society is now publishing yearly reports covering such events. Figure 4 summarizes those that took place in 2016, as shown in its January 2018 supplementary bulletin.
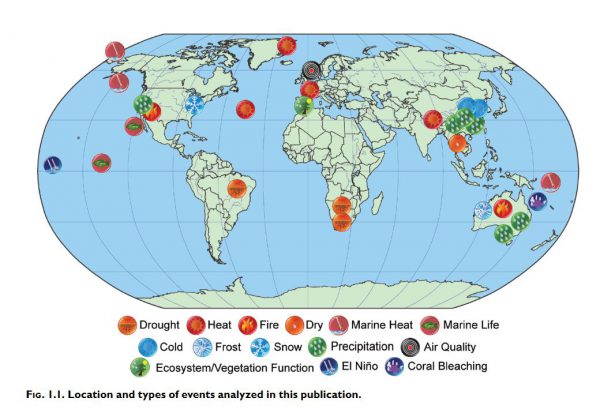 Figure 4 – Location and types of events analyzed in the special supplement to the recent Bulletin of the American Meteorological Society Vol 99, No 1, January 2018
Each event constitutes a chapter in this report. Here are two such events (in bold) and the authors’ conclusions as to their attributions.
The 2016 extreme warmth across Asia would not have been possible without climate change. The 2015/16 El Niño also contributed to regional warm extremes over Southeast Asia and the Maritime Continent.
Conclusions. All of the risk of the extremely high temperatures over Asia in 2016 can be attributed to anthropogenic warming. In addition, the ENSO condition made the extreme warmth two times more likely to occur. It is found that anthropogenic warming contributed to raising the level of event probability almost everywhere, although the 2015/16 El Niño contributed to a regional increase of warm events over the Maritime Continent, the Philippines, and Southeast Asia, but had little significant contribution elsewhere in Asia.
The record temperature of April 2016 in Thailand would not have occurred without the influence of both anthropogenic forcing and El Niño, which also increased the likelihood of low rainfall.
Conclusions. Our analysis demonstrates that anthropogenic climate change results in a clear shift of the April temperature distribution toward warmer conditions and a more moderate, albeit distinct, shift of the rainfall distribution toward drier Aprils in Thailand. The synergy between anthropogenic forcings and a strong El Niño was crucial to the breaking of the temperature record in 2016, which our results suggest would not have occurred if one of these factors were absent. Rainfall as low as in 2016 is found to be extremely rare in La Niña years. The joint probability for hot and dry events similar to April 2016 is found to be relatively small (best estimate of about 1%), which implies that in addition to the drivers examined here, other possible causes could have also played a role, like moisture availability and transport (especially in the context of the prolonged drought), atmospheric circulation patterns, and the effect of other non-ENSO modes of unforced variability.
The attributions described here are mostly determined via a mixed analysis of direct observations and computer simulations. Such techniques are common in science. But some of my colleagues believe that the use of computer simulations to address issues such as anthropogenic climate change is inappropriate. I will address an example taken from cosmology of how computers have been used successfully to describe physical phenomena.