The “heat dome” has been at the top of the news in recent days, starting almost immediately after the official start of summer on Sunday, June 20th. Sonya Landau, the editor of this blog, wrote a beautiful and timely guest post (June 22nd), reporting from under the dome in Tucson, Arizona. While it has resulted in dangerous heat in areas already known for their hot summers, this enormous dome has also had disastrous consequences in historically cooler regions like the Pacific Northwest. Press outlets have explained the heat dome as a result of high pressure in the atmosphere that blocks the dissipation of heat. Well, that certainly fits the description of the effects of the greenhouse gases that now cover the world. Wikipedia gives us a basic definition:
A greenhouse gas (GHG or GhG) is a gas that absorbs and emits radiant energy within the thermal infrared range, causing the greenhouse effect.
Last Monday, an Op-Ed in The New York Times, “That Heat Dome? Yeah, It’s Climate Change,” provided a more technical explanation of the heat dome in northwestern US and Canada:
The heat wave afflicting the Pacific Northwest is characterized by what is known as an omega block pattern, because of the shape the sharply curving jet stream makes, like the Greek letter omega (Ω). This omega curve is part of a pattern of pronounced north-south wiggles made by the jet stream as it traverses the Northern Hemisphere. It is an example of a phenomenon known as wave resonance, which scientists (including one of us) have shown is increasingly favored by the considerable warming of the Arctic.
The Op-Ed warned us that the heat dome is huge now and similar phenomena will only get a lot worse and more frequent unless we do something to slow them down. A recent report by the IEA (see last week’s blog) enumerated some of the steps we can take to make that happen. An article from December 2019 quotes some experts who argue that climate change is accelerating and we are all living under the threat:
Climate change and its effects are accelerating, with climate related disasters piling up, season after season.
“Things are getting worse,” said Petteri Taalas, Secretary General of the World Meteorological Organization, which on Tuesday issued its annual state of the global climate report, concluding a decade of what it called exceptional global heat. “It’s more urgent than ever to proceed with mitigation.”
But reducing greenhouse gas emissions to fight climate change will require drastic measures, Dr. Taalas said. “The only solution is to get rid of fossil fuels in power production, industry and transportation,” he said.
I thought it was time to quantify the concept.
NOAA (National Oceanic and Atmospheric Administration) and the Scripps Institution recently published the most up-to-date data of the atmospheric carbon dioxide concentrations measured at the Mauna Loa Observatory in Hawaii (see December 1, 2015 blog). These data are shown in Figure 1.
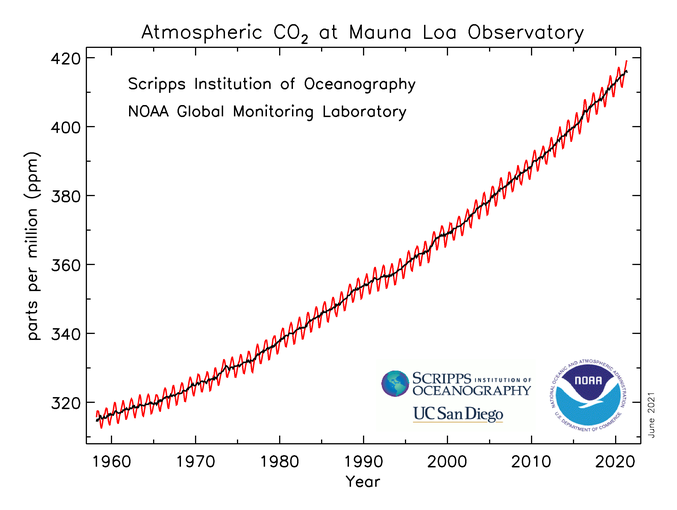 Figure 1
Back in 2015, I looked at a curve similar to Figure 1 and explained the yearly oscillations:
However, [the figure] also shows something else: superimposed on the steady CO2 concentrations in Mauna Loa are very regular oscillations. Such oscillations are absent from similar measurements taken in Antarctica and they vary with the latitude of the site. These oscillations directly exemplify the yearly cycle and the difference between each site’s carbon dioxide source and its sink. The fluctuations represent the full complexities of the carbon cycle as it equilibrates between the land, the air, and the ocean. The yearly cycles shown in Figure 3 were attributed to the large percentage of trees in the northern hemisphere that shed their leaves in the fall and regrow them in the spring. The corresponding result is that less carbon dioxide is captured during the winter than in the summer.
Figure 2 shows the updated parts of the curve (post-2015).
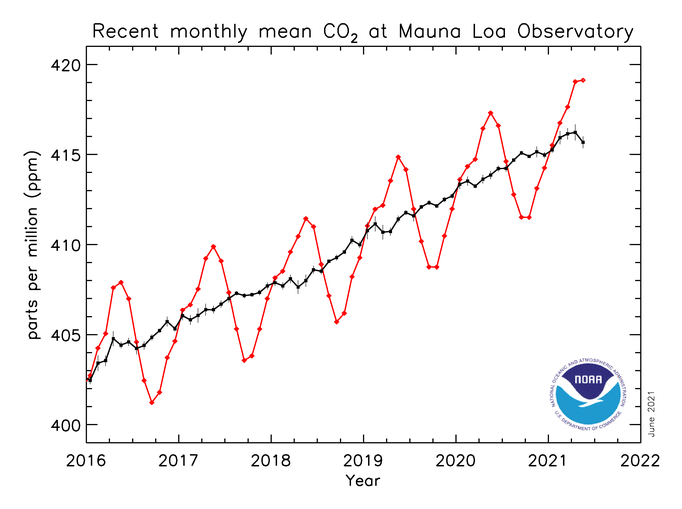
Figure 2
A simple inspection of Figure 1 makes it clear that the carbon dioxide emissions not only increase with time but accelerate. Fortunately, NOAA’s report also includes a table of the changes in the yearly emissions rates. This data is shown in Figure 3, from which we can see a linear increase in these rates: a constant acceleration.
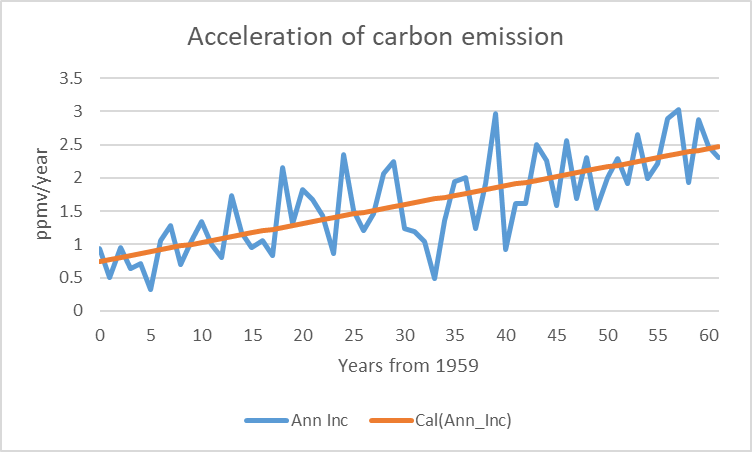
Figure 3
One-dimensional motion with constant acceleration is defined as:
(1) X(t) = X0 + V0*t + ½*A*t2
Where X is the displacement, V is velocity, A is acceleration, and t is time.
Velocity is defined as:
(2) V = V0 + A*t
The straight line in Figure 3, which was analyzed to give the best fit with the oscillations, has a slope of 0.028 ppmv/(year)2 and an intercept of 0.75 ppmv/year (parts per million volume, a common unit for concentrations of greenhouse gases in the air.
We can put these parameter values into Equation 1 to calculate when, assuming constant acceleration values, the concentration of carbon dioxide will double to 560 ppmv, compared to the pre-Industrial Revolution concentration of 280 ppmv:
0.014*t2 + 0.75*t +310 = 560
Solving for t, we get 110 years after the start of Figure 1 in 1959, which puts us in 2069. That’s beyond my lifetime but well within the expected lifetime of my children and grandchildren. It’s also way before the definition of “Now” in my book.
The change in global air temperature that corresponds to doubling the carbon dioxide concentration relative to preindustrial conditions is called “climate sensitivity.” This is probably the most important parameter to connect the carbon atmospheric concentration to global temperature.
Of course, the timing estimates in this blog are completely independent of any computer simulations, modeling, or scenario building. They rely completely on experimental results over the last 60 years, which include, among other developments, the worst pandemic in the last 100 years. The data show that the acceleration in the concentration of carbon dioxide over this period has been constant and we can assume that it will stay that way over the next 50 years unless we change global policies in significant ways.
Next week, I’ll discuss the significance of reaching the carbon sensitivity point in terms of temperature and livability. Meanwhile, you can scan through an earlier blog (July 10, 2018) on the role of feedback in estimating atmospheric concentrations of carbon dioxide and the expected temperature changes.
thanks for sharing
The science around blocking patterns and global warming is not settled,
“The dynamics of blocking is focused up at jet-stream level in the atmosphere and here models predict the strongest warming in the tropics. This strengthens the jet-stream winds, making it harder for blocks to form.”
“As Arctic warming strengthens, we expect it to impact the jet stream and this could act to increase blocking in some regions. Climate models currently suggest the competing influence of the warming tropics will be more important, consistent with an overall decrease in blocking.”
https://www.carbonbrief.org/jet-stream-is-climate-change-causing-more-blocking-weather-events
An interesting paradox – while the land area under the heat dome is inefficient at dissipating heat in general, it’s very good at dissipating heat to space. So in that respect the opposite of the GHE.