The Connection Between Carbon Concentration and Temperature
Last week, I used The Scripps Institute and NOAA’s recent measurements of the global carbon dioxide concentration (as measured in Mauna Loa, Hawaii) to calculate the acceleration in carbon dioxide atmospheric accumulation from 1959 to 2020. The timing of these measurements approximately corresponds with the suggested start of the Anthropocene (see my October 30, 2018 blog), when human activities started to become the dominant force behind the changes in atmospheric composition. The results show that over this 60-year period, the acceleration of the accumulation of carbon dioxide in the atmosphere has been approximately constant. Given this consistency, we have defined this acceleration as the business-as-usual scenario, from which we have calculated future levels. Under the same scenario, calculations have shown that the concentration of carbon dioxide will reach 560 ppmv of CO2 by the year 2069. This is only 48 years from today and 110 years after we started measuring, in 1959.
The value of 560 ppmv CO2 is considered a doubling of the preindustrial concentration of 280 ppmv. We call the projected effect that this doubling will have on global temperature climate sensitivity:
Climate sensitivity is a measure of how much the Earth’s climate will cool or warm after a change in the climate system, for instance, how much it will warm for doubling in carbon dioxide (CO2) concentrations.[1] In technical terms, climate sensitivity is the average change in the Earth’s surface temperature in response to changes in radiative forcing, the difference between incoming and outgoing energy on Earth.[2] Climate sensitivity is a key measure in climate science,[3] and a focus area for climate scientists, who want to understand the ultimate consequences of anthropogenic climate change.
Wikipedia also defines radiative forcing:
Radiative forcing is generally defined as the imbalance between incoming and outgoing radiation at the top of the atmosphere.[5] Radiative forcing is measured in Watts per square meter (W/m2), the average imbalance in energy per second for each square meter of the Earth’s surface.[6]
As the Wikipedia site makes clear, it is incredibly difficult to estimate climate sensitivity. I wrote about this a few years ago (July 10, 2018). One of the key difficulties in measurement has to do with the fact that most (2/3) of the impacts of the greenhouse gases are not directly connected to blocking infrared radiation (heat); rather, they affect the phenomenon indirectly, through various feedback mechanisms. As I explained in my earlier blog, the main feedback mechanism comes from accelerated water evaporation from our oceans. While we mostly talk about CO2, water vapor is a powerful greenhouse on its own.
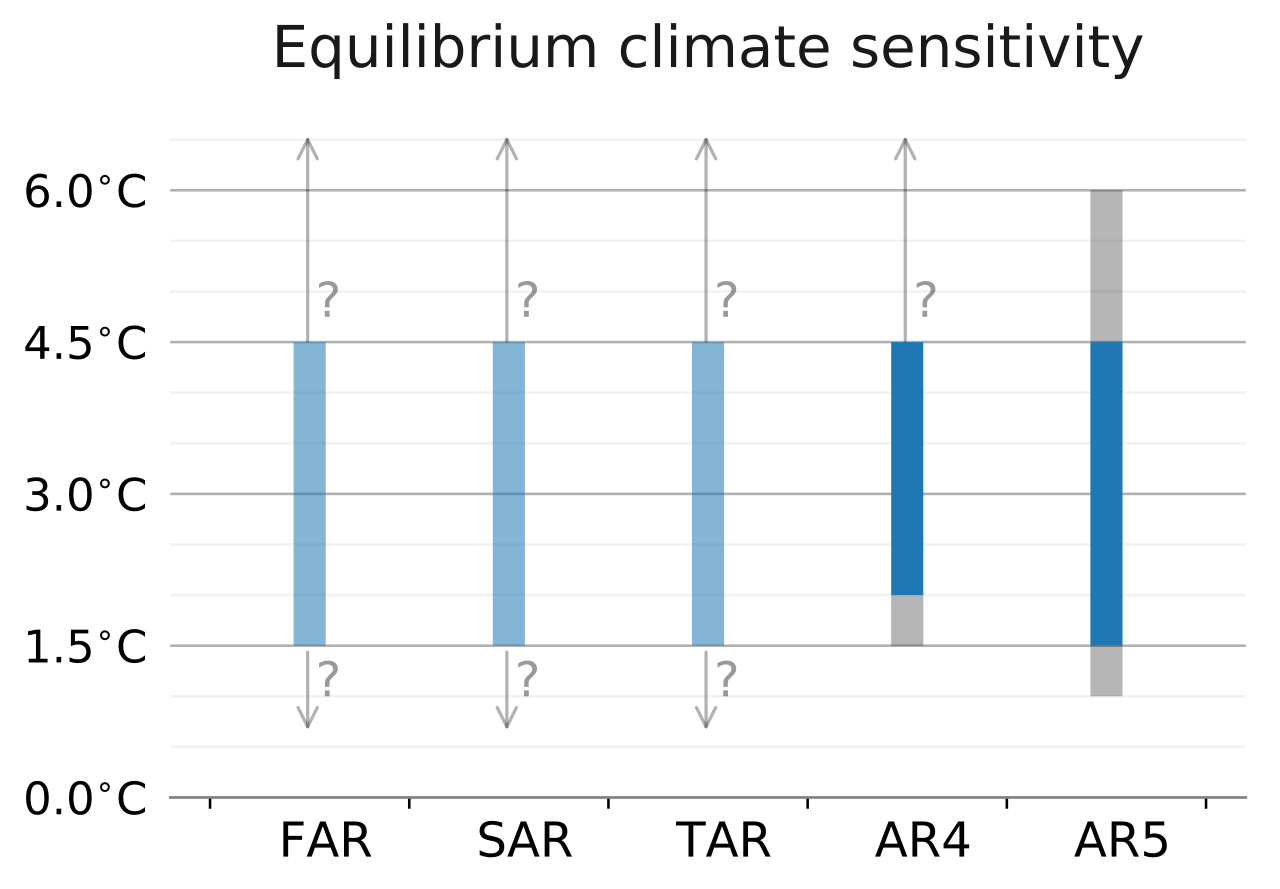
Below are Wikipedia’s aggregations of the IPCC’s predictions, accumulated from various reports throughout the years:
Historical estimates of climate sensitivity from the IPCC assessments. The first three reports gave a qualitative likely range, while the fourth and fifth assessment report formally quantified the uncertainty. The dark blue range is judged as being more than 66% likely.
The most recent IPCC report summarizes the state of knowledge on this issue:
The 2013 IPCC Fifth Assessment Report reverted to the earlier range of 1.5 to 4.5 °C (2.7 to 8.1 °F) (with high confidence), because some estimates using industrial-age data came out low. (See the next section for details.)[18] The report also stated that ECS is extremely unlikely to be less than 1 °C (1.8 °F) (high confidence), and is very unlikely to be greater than 6 °C (11 °F) (medium confidence). These values were estimated by combining the available data with expert judgement.[53]
When the IPCC began to produce its IPCC Sixth Assessment Report many climate models began to show higher climate sensitivity. The estimates for Equilibrium Climate Sensitivity changed from 3.2 °C to 3.7 °C and the estimates for the Transient climate response from 1.8 °C, to 2.0 °C. This is probably due to better understanding of the role of clouds and aerosols.[60]
We continue to learn that uncertainty leads to denial. We can see similar problems with today’s groups who refuse to get the approved COVID-19 vaccines. Unfortunately, mass refusal to get vaccinated means we cannot reach herd immunity, a key part of what makes vaccines effective in the long run. Both the US and Brazil are seeing correlations between anti-vaccine sentiments and presumed (sometimes “manufactured”) uncertainty about their effectiveness/effects:
- It’s Time for the F.D.A. to Fully Approve the mRNA Vaccines
- Measuring the impact of COVID-19 vaccine misinformation on vaccination intent in the UK and USA
- Miracle Cures and Magnetic People. Brazil’s Fake News Is Utterly Bizarre.
With COVID-19, we can see the effects of this uncertainty play out in real-time. Since climate change has a longer timeframe, it becomes more difficult to show the direct correlations between global anthropogenic carbon emissions and the resulting increase in local temperatures worldwide. We need all the help that we can get in translating that addressing climate change is just as urgent as slowing the pandemic.
Figure 2 shows various organizations’ current instrumental measurements of rising global temperatures.
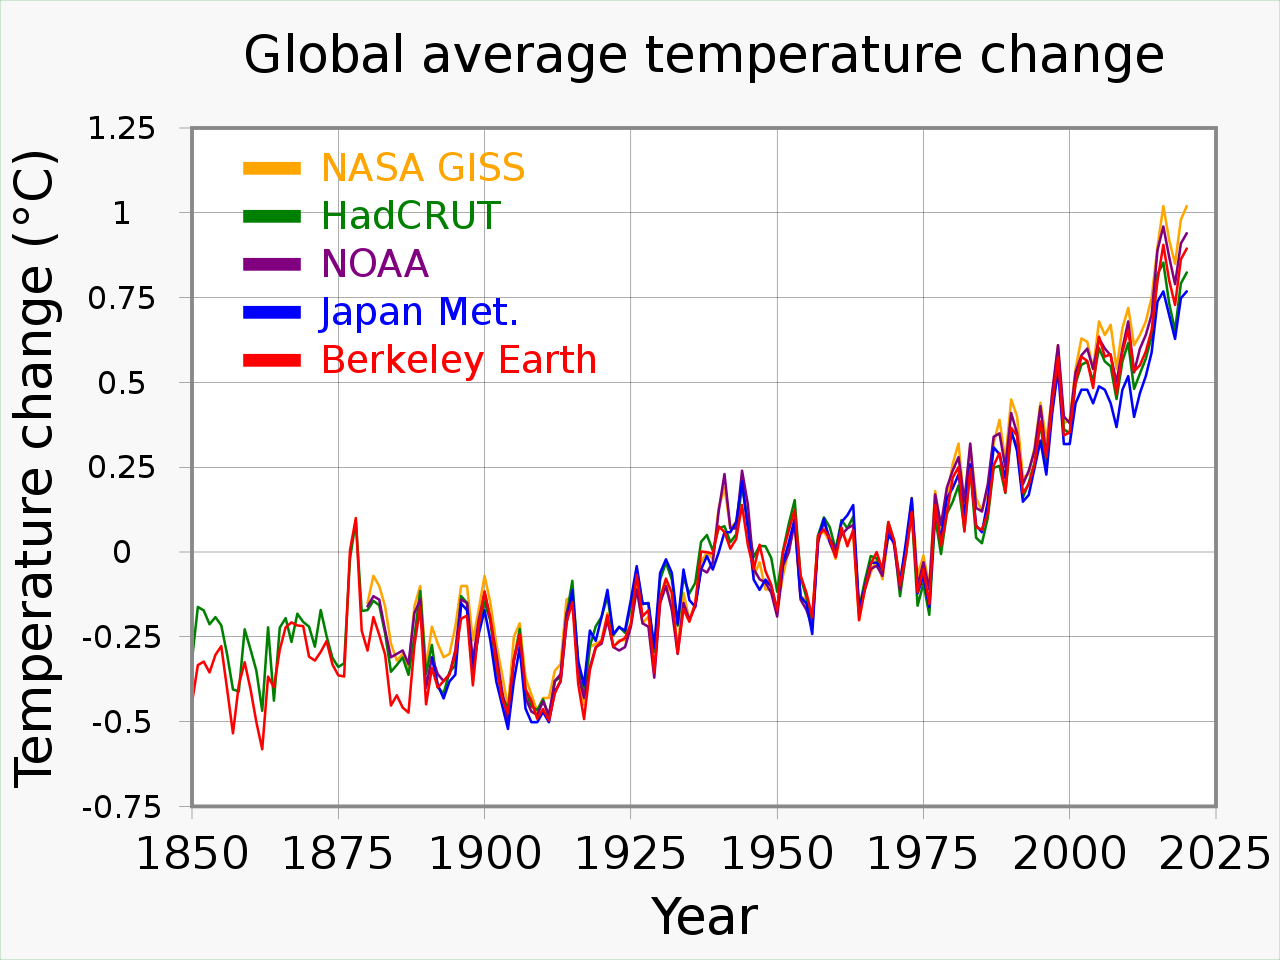
Figure 2
Wikipedia describes the methodology:
The temperature data for the record come from measurements from land stations and ships. On land, temperature sensors are kept in a Stevenson screen or a maximum minimum temperature system (MMTS). The sea record consists of surface ships taking sea temperature measurements from engine inlets or buckets. The land and marine records can be compared.[31] Land and sea measurement and instrument calibration is the responsibility of national meteorological services. Standardization of methods is organized through the World Meteorological Organization (and formerly through its predecessor, the International Meteorological Organization).[32]
Figure 3 describes the IPCC’s take on the global risks associated with rising temperatures. This particular IPCC report also presents a summary of the reasoning for the Paris agreement (see Dec 14, 2015 blog). Next week, I’ll look at this report in more depth. The colors in all of the categories in Figure 3 show major changes above 1.5oC (2.7oF).
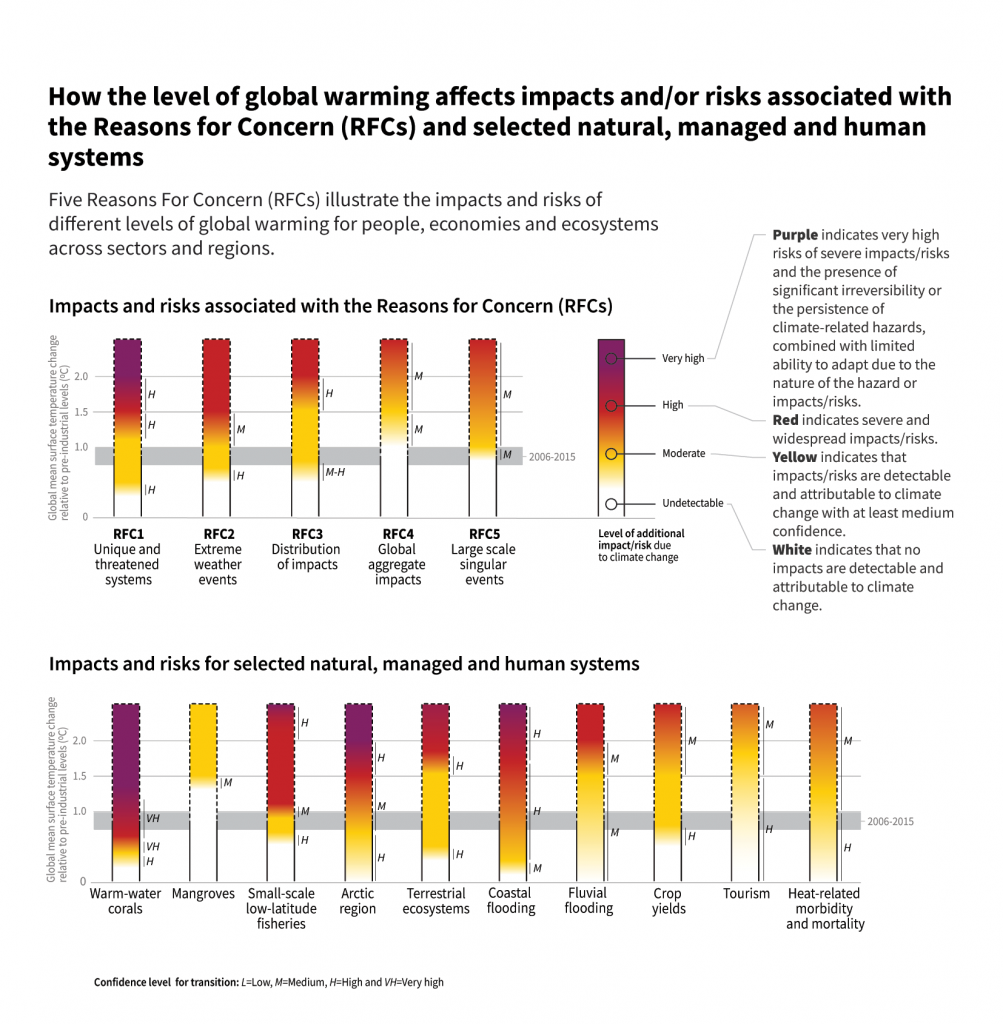
Figure 3 – Risks posed by rising temperatures
The majority of people don’t live in areas with “average” temperatures. At this point, most people have moved to cities, which can act as heat islands where the temperature can reach double the measured “average.” (See the July 23, 2019 blog on this issue). I’ll describe how these facts impact individuals’ health and mortality in future blogs.