My last three blogs focused on our collective attempts to limit anthropogenic global warming to an increase of 1.5oC in global temperature or, failing that, no more than 2oC.
The series of blogs started with a detailed road map recently outlined by the IEA (International Energy Agency) and continued with my own detailed description of the “business as usual” situation characterized by a constant trend of global acceleration of greenhouse gas usage. The trend, which started about 60 years ago and is calculated based on the measured increase of the atmospheric concentrations of these gases, continues to prevail now.
But where did these 1.5-20C targets come from? The IPCC (International Panel on Climate Change) has long been aware of this acceleration of greenhouse gas usage and set these targets almost immediately after the Paris Agreement was signed (See the December 14, 2015 blog). The organizers of the Paris meeting requested that the IPCC write a detailed report to justify those targets. The corresponding SR15 report came out in 2018. This blog is focused on some key conclusions and data from that report.
I have included surveys of many aspects of the IPCC reports through my nine years running this blog. Every report (at least those I have read) starts with a section titled, “Summary for Policy Makers” (the October 14, 2014 blog analyzes one of the earlier reports), usually referred to as SPM. The SR15 is no exception. The two paragraphs below are taken from the preamble to this section:
The IPCC accepted the invitation in April 2016, deciding to prepare this Special Report on the impacts of global warming of 1.5°C above pre-industrial levels and related global greenhouse gas emission pathways, in the context of strengthening the global response to the threat of climate change, sustainable development, and efforts to eradicate poverty.
This Summary for Policymakers (SPM) presents the key findings of the Special Report, based on the assessment of the available scientific, technical and socio-economic literature relevant to global warming of 1.5°C and for the comparison between global warming of 1.5°C and 2°C above pre-industrial levels. The level of confidence associated with each key finding is reported using the IPCC calibrated language. The underlying scientific basis of each key finding is indicated by references provided to chapter elements. In the SPM, knowledge gaps are identified associated with the underlying chapters of the Report.
The first two high points of the SPM state the following:
A.2.1. Anthropogenic emissions (including greenhouse gases, aerosols and their precursors) up to the present are unlikely to cause further warming of more than 0.5°C over the next two to three decades (high confidence) or on a century time scale (medium confidence). {1.2.4, Figure 1.5}
A.2.2. Reaching and sustaining net zero global anthropogenic CO2 emissions and declining net non-CO2 radiative forcing would halt anthropogenic global warming on multi-decadal times scales (high confidence). The maximum temperature reached is then determined by cumulative net global anthropogenic CO2 emissions up to the time of net zero CO2 emissions (high confidence) and the level of non-CO2 radiative forcing in the decades prior to the time that maximum temperatures are reached (medium confidence). On longer time scales, sustained net negative global anthropogenic CO2 emissions and/or further reductions in non-CO2 radiative forcing may still be required to prevent further warming due to Earth system feedbacks and to reverse ocean acidification (medium confidence) and will be required to minimize sea level rise (high confidence). {Cross-Chapter Box 2 in Chapter 1, 1.2.3, 1.2.4, Figure 1.4, 2.2.1, 2.2.2, 3.4.4.8, 3.4.5.1, 3.6.3.2}
The SPM includes some key figures, among them: Figure 1 below and Figure 3 from last week’s blog, which summarizes risks posed by rising temperature. Last week’s blog also included the definition of radiative forcing, as shown in Figure 1.
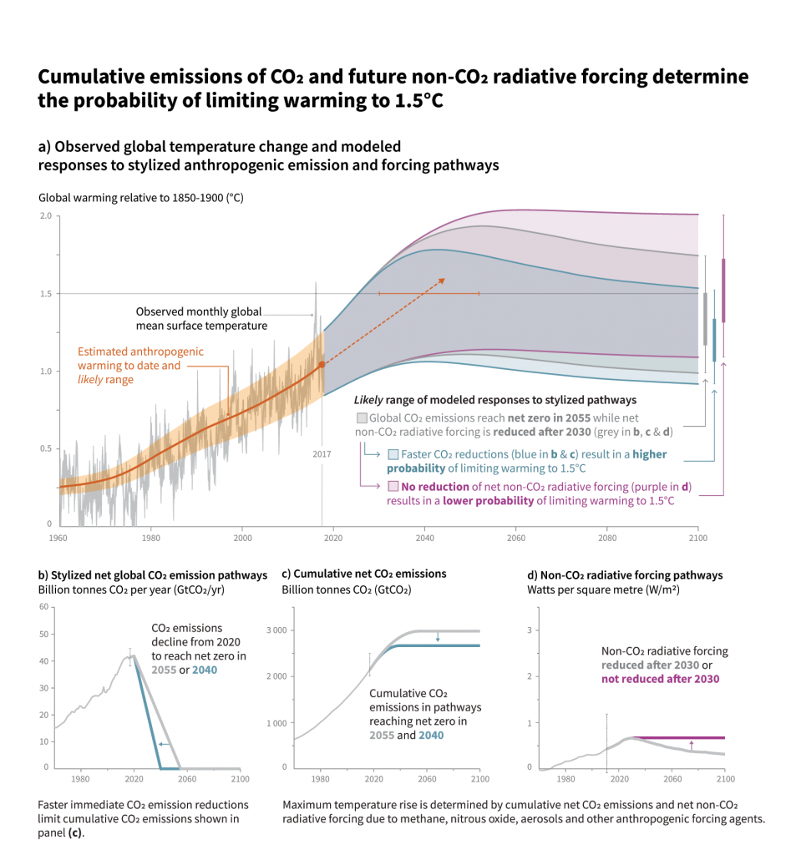
Figure 1
Panel a: Observed monthly global mean surface temperature (GMST, grey line up to 2017, from the HadCRUT4, GISTEMP, Cowtan–Way, and NOAA datasets) change and estimated anthropogenic global warming (solid orange line up to 2017, with orange shading indicating assessed likely range). Orange dashed arrow and horizontal orange error bar show respectively the central estimate and […]
(You can find a fuller explanation of Figure 1 in the original report, part of the downloadable 630-page high-resolution pdf).
The report contains five more detailed chapters and an explanatory appendix.
Below, I cite a few introductory paragraphs and a key figure from the first chapter:
Human-induced warming reached approximately 1°C (likely between 0.8°C and 1.2°C) above pre-industrial levels in 2017, increasing at 0.2°C (likely between 0.1°C and 0.3°C) per decade (high confidence). Global warming is defined in this report as an increase in combined surface air and sea surface temperatures averaged over the globe and over a 30-year period. Unless otherwise specified, warming is expressed relative to the period 1850–1900, used as an approximation of pre-industrial temperatures in AR5. For periods shorter than 30 years, warming refers to the estimated average temperature over the 30 years centered on that shorter period, accounting for the impact of any temperature fluctuations or trend within those 30 years.
Warming greater than the global average has already been experienced in many regions and seasons, with higher average warming over land than over the ocean (high confidence). Most land regions are experiencing greater warming than the global average, while most ocean regions are warming at a slower rate. Depending on the temperature dataset considered, 20–40% of the global human population live in regions that, by the decade 2006–2015, had already experienced warming of more than 1.5°C above pre-industrial in at least one season (medium confidence). {1.2.1, 1.2.2}
Past emissions alone are unlikely to raise global-mean temperature to 1.5°C above pre-industrial levels (medium confidence), but past emissions do commit to other changes, such as further sea level rise (high confidence). If all anthropogenic emissions (including aerosol-related) were reduced to zero immediately, any further warming beyond the 1°C already experienced would likely be less than 0.5°C over the next two to three decades (high confidence), and likely less than 0.5°C on a century time scale (medium confidence), due to the opposing effects of different climate processes and drivers. A warming greater than 1.5°C is therefore not geophysically unavoidable: whether it will occur depends on future rates of emission reductions. {About committed warming}
This report defines ‘warming’, unless otherwise qualified, as an increase in multi-decade global mean surface temperature (GMST) above pre-industrial levels. Specifically, warming at a given point in time is defined as the global average of combined land surface air and sea surface temperatures for a 30-year period centered on that time, expressed relative to the reference period 1850–1900 (adopted for consistency with Box SPM.1 Figure 1 of IPCC (2014a))
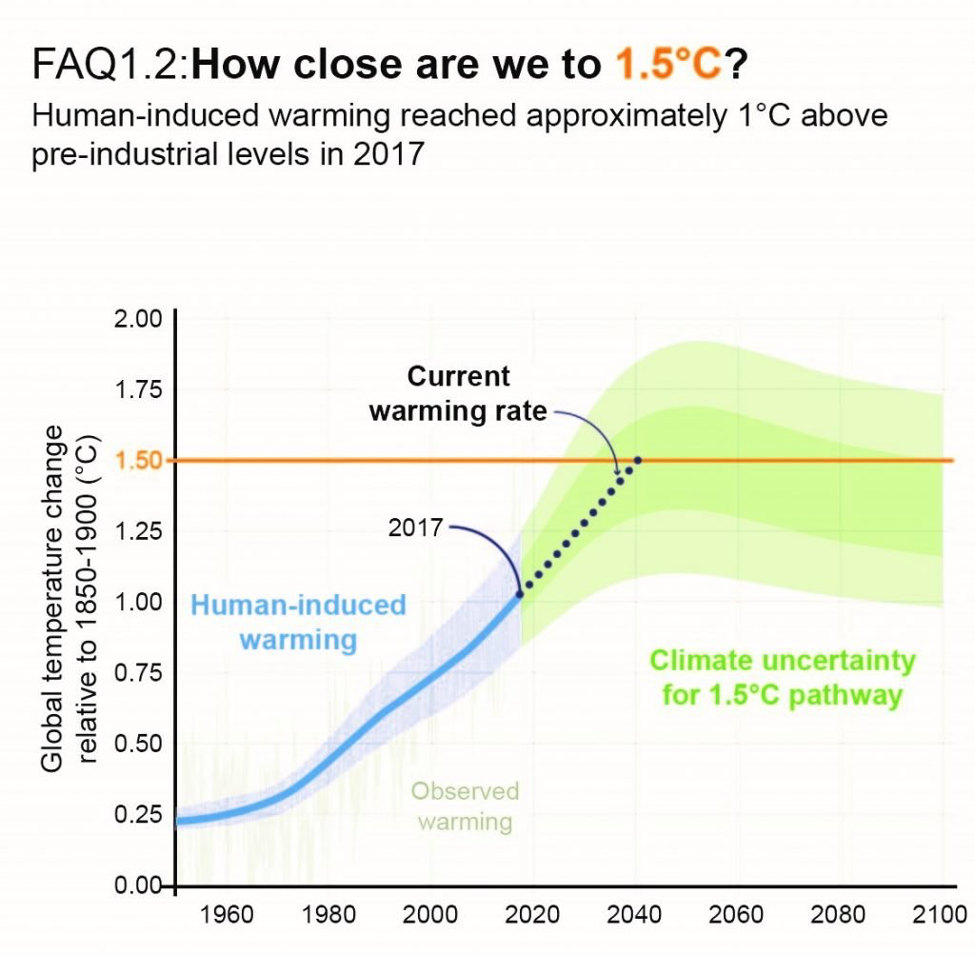 Figure 2
Figure 3 shows another key finding from Chapter 3 in the report. It demonstrates the range of local warmings throughout the globe as the temperature increases from 1.50C to 20C above pre-industrial levels. As you can see, a significant fraction of the world would become unlivable, especially in the latter scenario.
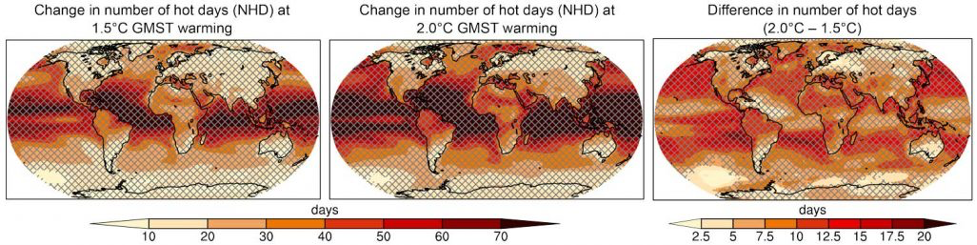
Figure 3 (taken from Chapter 3) – Projected changes in the number of hot days (NHD; 10% warmest days) at 1.5°C (left) and at 2°C (middle) of global warming compared to the pre-industrial period (1861–1880), and the difference between 1.5°C and 2°C of warming (right).
In the next blog (or two) I will try to analyze the concept of what is “hot enough to be unlivable.” Clearly, however, in order to retain livable conditions, we will need to veer significantly from the business-as-usual scenario ASAP–not in the future but now–by following the guidelines of the IEA (International Energy Agency) report. The upcoming COP26 (“Conference of the Parties” global climate summit with almost every country on Earth) meeting in Glasgow, UK, scheduled to run from October 31 through November 12, 2021, is a good opportunity for that. The governments of the European Union and the US recognize it and they recently came with detailed plans on how to achieve these goals. (Europe’s plan is here; see all four April blogs this year for the US plan).
Unfortunately, both plans at this point are non-binding proposals. President Biden augmented his proposals with some executive orders but they were mostly drafted to counter President Trump’s previous policies that had erased prior mitigation efforts.
The relative success of the 2015 Paris agreement was driven to a large degree by the almost unanimous cooperation of the developing countries. One key element in this was a set of commitments from developed countries to support developing countries in the mitigation process through the Green Climate Fund (see the March 2, 2021 blog). Lately, we have heard very little so far in the way of declarations from the EU or the US on this issue.
Stay tuned.