The two previous blogs focused on global fertility decline. We are in the middle of a global transition from an increase to a decline in population; the population is estimated to peak around mid-century. Last week’s blog covered some of the driving forces behind this transition. Over the next two weeks, I will discuss the economic consequences of this transition and the resulting political consequences.
Consequences that will be discussed as part of the economic consequences will include a rise in the dependency ratio, a crisis in end-of-life care, and a decline in military strength. All these impacts result from changes to the age distribution of the population. The age distribution of the population is described in the form of population pyramids. This blog will focus on some of the consequences of the population decline on the population pyramids.
I discussed population pyramids in an earlier blog (January 21, 2014). Before, fertility rates below replacement (2.1) were limited to rich countries; now, as we saw in the last two blogs, below-replacement fertility is expanding around the world and it’s time to return to this issue.
Figure 1 – 2017 Population pyramids of three countries with different fertility and growth patterns (Source: Visual Capitalist)
Figure 1 shows the 2017 population pyramids of three countries with different population growth patterns. The Democratic Republic of Congo has a fertility rate well above replacement, resulting in a fast growth rate (in 2022 estimated growth was 3.25%). The United States’ fertility is well below replacement (1.6), with a recent net growth rate of 0.53% that comes mainly from immigration. Lastly, we have Germany, whose fertility rate is almost identical to that of the US (1.62) but has an almost zero recent growth rate (0.03%). The data for the US and Germany were taken from Table 1 in a recent blog (January 30, 2024). In both the United States and Germany, immigrants constitute significant parts of the population pyramid.
Figure 2 shows the contributions of both the immigrants and the US-born to the population pyramid of the US (2022). I was not entirely clear from the MPI (Migration Policy Institute) description of the immigrants’ contribution how they factored in the inclusion of naturalized and authorized (green card) immigrants vs. illegal immigrants. As was mentioned in the first blog in this series (January 30, 2024), in the US there are presently close to 50 million immigrants (not born in the US). A rough estimate is that about 1/3 of these immigrants are not naturalized. Summing up the number of immigrants in Figure 2, one arrives at a number close to 40 million people. This roughly corresponds to authorized and naturalized immigrants (it takes many years between authorization and naturalization).
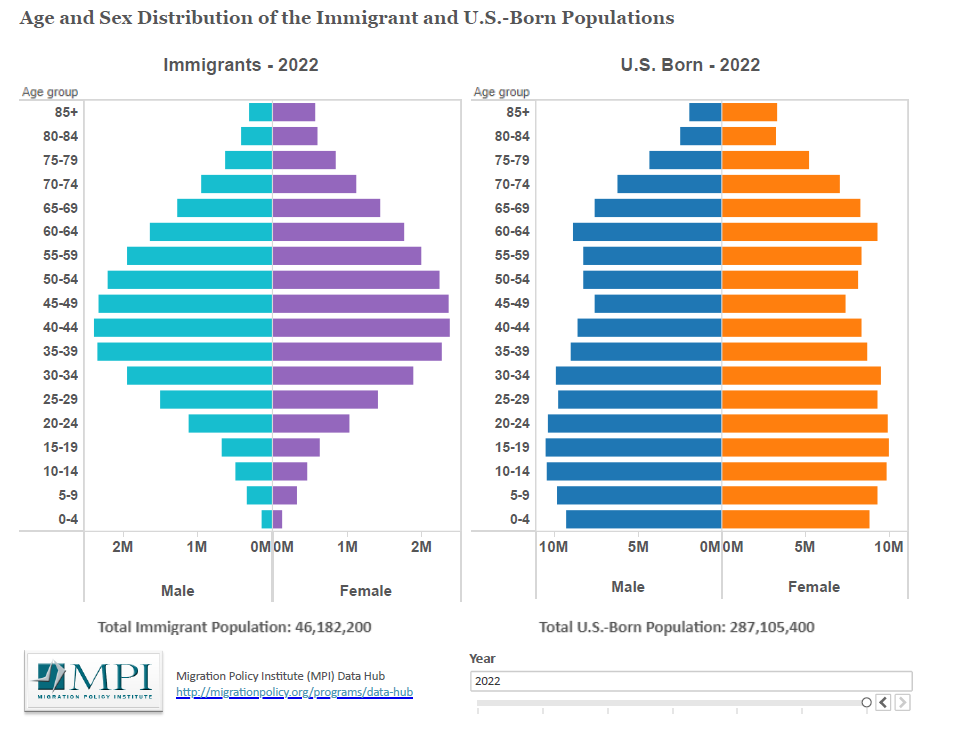 Figure 2 – Population pyramids of immigrants and US-born Americans (Source: Migration Policy Institute)
Below is what MPI writes about the immigrant population:
Immigrant population: The shape of the age-sex pyramid of the immigrant population is very different from that of the native-born population for a number of reasons. First, many migrants migrate to find work abroad, so a high number in the economically active 20-to-54 age bracket is not uncommon. As can be seen here, the majority of immigrants in 2022 were adults between the ages of 20 and 54. Second, in general, children are less likely to migrate by themselves and adult immigrants tend to migrate with few or no children. This helps explain the relatively small amount of people ages 20 and younger. There is another reason, however: the children born in the United States to adult immigrants are included in the native-born population estimates. Third, people are less likely to migrate at older ages. In the foreign-born age-sex pyramid, there are fewer people in the retirement-age groups (65 and over). This low number of older immigrants also has to do with some returning home for retirement and the death of some older immigrants. All of these factors give the foreign-born age-sex pyramid its “diamond shape,” making it significantly different from the native population pyramid. About 46.2 million immigrants resided in the United States in 2022.
In terms of economic impact, the rise in dependency originates from the relative decline of the working segment of the population as a percentage of the general population. It is also important to keep in mind the corresponding decrease in the non-working segments, including youth and the elderly. Almost all rich economies are committed to supporting both their old and young populations at a variety of levels. This support takes various forms that impact the well-being of a country. I dedicated many of my previous blogs to describing the difficulties the American education system now faces because of declining enrollments. Education is part of the support system for the young that every country is committed to on various levels. Social Security is part of insurance that many countries use to support the elderly (based on their contributions during their working times). Healthcare, in many cases, is a mechanism that countries use to support both the old and the young. The next blogs will expand on these issues.