Our government’s executive and legislative branches, are in the midst of discussing two important issues: tax breaks and climate change. Well, in truth, the only real discussion going on has to do with the tax legislation. Climate change is only being addressed indirectly – The Trump administration officially approved the congressionally-mandated climate change report (discussed previously in the August 15, 2017 blog) that was compiled by scientists from 13 government agencies. It now becomes an “official” document, in spite of the fact the White House claims that the President never read it. Meanwhile, right now in Bonn, Germany the 23rd Conference of the Parties (COP23) to the United Nations Framework Convention on Climate Change (UNFCCC) is taking place. One hundred ninety-five nations are there to discuss implementation of the 2015 Paris Agreement. As we all remember, President Trump announced in June his intention to withdraw the US from this agreement. Nevertheless, the US is a full participant in this meeting. Syria has just announced that it will be joining this agreement, making the US the only country in the world to back out.
Let me now come back to taxes, starting with Forbes magazine’s “Tax Reform for Dummies”:
You see, they were planning to repeal Obamacare using something called the “budget reconciliation process,” and pay attention, because this becomes relevant with tax reform. Using this process, Congress can pass a bill that’s attached to a fiscal year budget so long as:
- The bill directly impacts revenue or spending, and
- The bill does not increase the budget deficit after the end of the ten-year budget window (the so-called “Byrd Rule.)
More importantly, using the reconciliation process, Republicans can pass a bill with only a simple majority in the Senate (51 votes), rather than the standard 60. And as mentioned above, the GOP currently holds 52 seats in the Senate, meaning it could have pushed through its signature legislation without a SINGLE VOTE from a Democrat, which is particularly handy considering that vote was never coming.
Well, the Republicans in Congress were able to pass this resolution with a simple majority, specifying that by using dynamic scoring, they will not increase the budget deficit after the specified 10-year period. They set the limit for this accounting as a deficit no larger than $1.5 trillion (1,500 billion to those of us that need help with big numbers). Here is an explanation of dynamic scoring:
Tax, spending, and regulatory policies can affect incomes, employment, and other broad measures of economic activity. Dynamic analysis accounts for those macroeconomic impacts, while dynamic scoring uses dynamic analysis in estimating the budgetary impact of proposed policy changes.
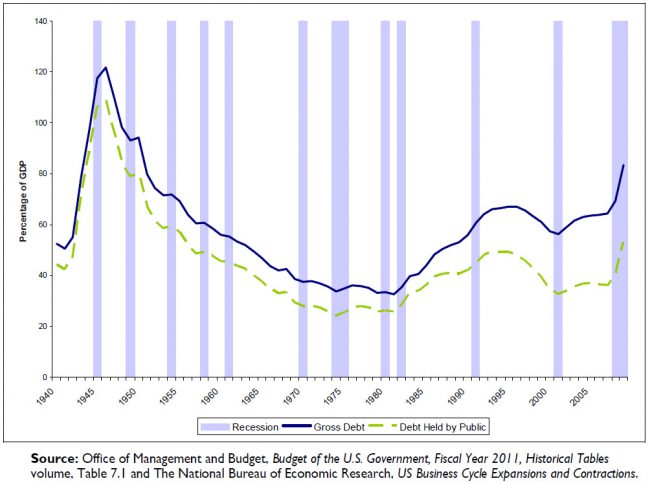
To give you an understanding of that timeline and budget, here’s a graph of our national deficit:

Figure 1 – Post WWII budget deficit in the US
Republican rationale for dynamic scoring in tax cuts is that, “Tax cuts pay for themselves”:
Ted Cruz got at a similar idea, referencing the tax plan he unveiled Thursday: “[I]t costs, with dynamic scoring, less than $1 trillion. Those are the hard numbers. And every single income decile sees a double-digit increase in after-tax income. … Growth is the answer. And as Reagan demonstrated, if we cut taxes, we can bring back growth.”
Tax cuts can boost economic growth. But the operative word there is “can.” It’s by no means an automatic or perfect relationship.
We know, we know. No one likes a fact check with a non-firm answer. So let’s dig further into this idea.
There’s a simple logic behind the idea that cutting taxes boosts growth: Cutting taxes gives people more money to spend as they like, which can boost economic growth.
Many — but by no means all— economists believe there’s a relationship between cuts and growth. In a 2012 survey of top economists, the University of Chicago’s Booth School of Business found that 35 percent thought cutting taxes would boost economic growth. A roughly equal share, 35 percent, were uncertain. Only 8 percent disagreed or strongly disagreed.
But in practice, it’s not always clear that tax cuts themselves automatically boost the economy, according to a recent study.
“[I]t is by no means obvious, on an ex ante basis, that tax rate cuts will ultimately lead to a larger economy,” as the Brookings Institution’s William Gale and Andrew Samwick wrote in a 2014 paper. Well-designed tax policy can increase growth, they wrote, but to do so, tax cuts have to come alongside spending cuts.
And even then, it can’t just be any spending cuts — it has to be cuts to “unproductive” spending.
“I want to be clear — one can write down models where taxes generate big effects,” Gale told NPR. But models are not the real world, he added. “The empirical evidence is quite different from the modeling results, and the empirical evidence is much weaker.”
President Reagan’s tax cut that Senator Cruz is referring to took place in 1981 in the middle of a serious recession. But it came at the heels of a post-war deficit. The tax cut did not pay for itself.
We can now return to the executive summary that precedes the recently-approved government Climate Science Special Report. I am condensing it into the main , each of which receives a detailed discussion in the full 500-page report:
- Global annually averaged surface air temperature has increased by about 1.8°F (1.0°C) over the last 115 years (1901–2016). This period is now the warmest in the history of modern civilization.
- It is extremely likely that human activities, especially emissions of greenhouse gases, are the dominant cause of the observed warming since the mid-20th century.
- Thousands of studies conducted by researchers around the world have documented changes in surface, atmospheric, and oceanic temperatures; melting glaciers; diminishing snow cover; shrinking sea ice; rising sea levels; ocean acidification; and increasing atmospheric water vapor.
- Global average sea level has risen by about 7–8 inches since 1900, with almost half (about 3 inches) of that rise occurring since 1993. The incidence of daily tidal flooding is accelerating in more than 25 Atlantic and Gulf Coast cities in the United States.
- Global average sea levels are expected to continue to rise—by at least several inches in the next 15 years and by 1–4 feet by 2100. A rise of as much as 8 feet by 2100 cannot be ruled out.
- Heavy rainfall is increasing in intensity and frequency across the United States and globally and is expected to continue to increase.
- Heatwaves have become more frequent in the United States since the 1960s, while extreme cold temperatures and cold waves are less frequent; over the next few decades (2021–2050), annual average temperatures are expected to rise by about 2.5°F for the United States, relative to the recent past (average from 1976–2005), under all plausible future climate scenarios.
- The incidence of large forest fires in the western United States and Alaska has increased since the early 1980s and is projected to further increase.
- Annual trends toward earlier spring melt and reduced snowpack are already affecting water resources in the western United States. Chronic, long-duration hydrological drought is increasingly possible before the end of this century.
- The magnitude of climate change beyond the next few decades will depend primarily on the amount of greenhouse gases (especially carbon dioxide) emitted globally. Without major reductions in emissions, the increase in annual average global temperature relative to preindustrial times could reach 9°F (5°C) or more by the end of this century. With significant reductions in emissions, the increase in annual average global temperature could be limited to 3.6°F (2°C) or less.
We constantly worry what kind of damage we in the US are about to experience from these impacts, given the prevailing business-as-usual scenario. Fortunately, a detailed paper in Science Magazine (Science 356, 1362 (2017)) gives us some answers:
Estimating economic damage from climate change in the United States
Solomon Hsiang,1,2*† Robert Kopp,3*† Amir Jina,4† James Rising,1,5†
Michael Delgado,6 Shashank Mohan,6 D. J. Rasmussen,7 Robert Muir-Wood,8
Paul Wilson,8 Michael Oppenheimer,7,9 Kate Larsen,6 Trevor Houser6
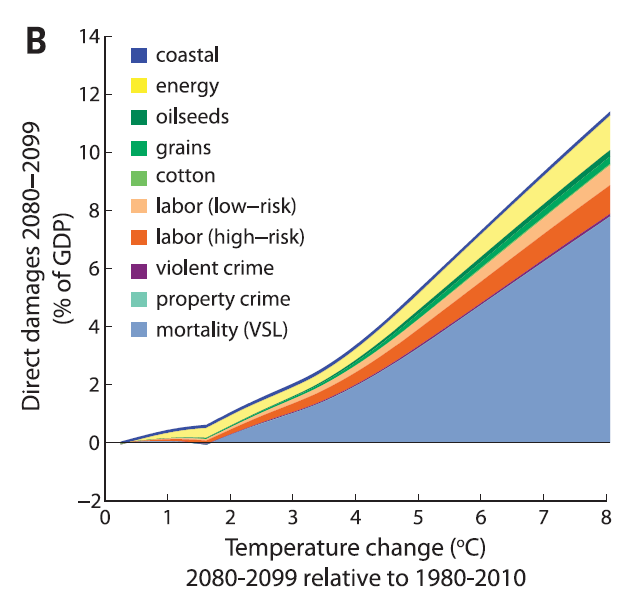
Estimates of climate change damage are central to the design of climate policies. Here, we develop a flexible architecture for computing damages that integrates climate science, econometric analyses, and process models. We use this approach to construct spatially explicit, probabilistic, and empirically derived estimates of economic damage in the United States from climate change. The combined value of market and nonmarket damage across analyzed sectors—agriculture, crime, coastal storms, energy, human mortality, and labor—increases quadratically in global mean temperature, costing roughly 1.2% of gross domestic product per +1°C on average. Importantly, risk is distributed unequally across locations, generating a large transfer of value northward and westward that increases economic inequality. By the late 21st century, the poorest third of counties are projected to experience damages between 2 and 20% of county income (90% chance) under business-as-usual emissions (Representative Concentration Pathway 8.5).
 Figure 2 – Direct damage in various sectors as a function of rising temperature since the 1980s
The paper’s abstract above indicates a negative impact of 1.2% of GDP for each 1oC (1.8oF) rise. The current GDP of the US is around $18 trillion, so 1.2% of that per 1oC amounts to $216 billion. If we take the recent “typical” growth rate of the economy at 2% it amounts to $360 billion/year. The loss for 1oC of warming amounts to 60% of this “typical” growth.
Accounting through dynamic scoring should count losses as well as gains – in this case, those resulting from climate change. Next week I will expand on this topic.
