Tackling Environmental Justice: Sovereign State against the Individual.

Last week, I started the discussion of how developing countries can contribute to alleviating anthropogenic (human caused) climate change.  The main goal is to mitigate climate change by achieving a global agreement to transition to more sustainable energy choices. I made mention of the important role efficiency could play for developing countries in using energy resources to enhance their GDP. (Interestingly, the same date that I posted last week also marks the beginning of the COP18 Doha Climate Change Conference to start the continuing efforts to reach global agreements on mitigation and adaptation policies.) Following Sandy’s impact on the most populated region in the States, and President Obama’s recent reelection, there is now some optimism that the United Stated might show heightened leadership in the struggle against climate change. I started the November 26 blog with Governor Romney’s response to a ScienceDebate question about his thoughts on Climate Change. I will repeat the quote here in order to emphasize a different issue:

The reality is that the problem is called Global Warming, not America Warming. China long ago passed America as the leading emitter of greenhouse gases. Developed world emissions have leveled off while developing world emissions continue to grow rapidly, and developing nations have no interest in accepting economic constraints to change that dynamic. In this context, the primary effect of unilateral action by the U.S. to impose costs on its own emissions will be to shift industrial activity overseas to nations whose industrial processes are more emissions-intensive and less environmentally friendly. That result may make environmentalists feel better, but it will not better the environment.

I would like to explore this claim that compares China to the United States in terms of overall responsibility to reduce its carbon footprint by shifting its energy sources. It is important because Governor Romney’s statement can be understood as advocating that as long as China does not reduce its carbon footprint, the US will follow suit, focusing only on R&D in order to not sacrifice economic advantages to China. The argument has a NIMBY (Not In My Backyard) flavor that I discussed in a previous blog (June 18) – we recognize the need to act, but as long as China and other developing countries refuse to get involved, we will deny our own duty.

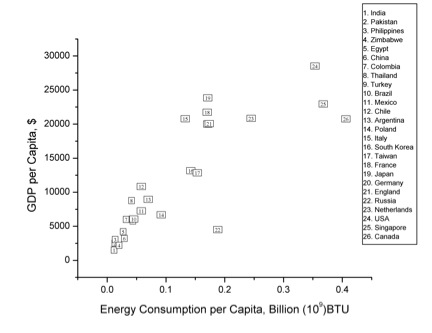
In the table below I ask undergraduates from my course (General Education – no prerequisites) to use primary sources to collect some relevant data about four countries and the World, and to answer a few questions by evaluating this data. I have filled in part of the table with the appropriate data for 2008 – the last year that data were available for the indicators in which I was interested.  

Fill up the following table:

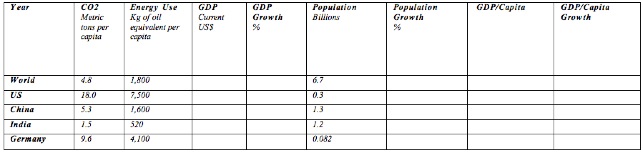
Rank the four countries in terms of total energy use and CO2 emissions.

  1.   Compare (in %) the top user and emitter with World use and emission.
  2.   Rank the four countries in terms of energy use and CO2 emission per capita, and compare the numbers with global data.
  3.   If the GDP growth continues – how many years will it take China to catch up to the US?
  4.   If the GDP/Capita growth continues – how many years it will take China to catch up to the US?
  5.   What will the World’s GDP be at that time?
  6.   What will the World’s population be at that time?
  7.   If you assume that the last three terms of the IPAT equation will not change – what will the World’s CO2 emission be at that time?
  8.   Assume that only half of the emissions will stay in the atmosphere and that the Climate Sensitivity is 2.50C for doubling the concentration of CO2 compared to the pre-industrial levels – what will the climate consequences of 8 be?

Problems started with the first question – Half of the class has ranked both energy use and Carbon Dioxide emission in the following order – US, Germany, China and India.

Now – try it yourself and make a comment.

Large outcry was heard when answering the second question – “Professor – how it can be that the top energy user (US) is using 417% of the World’s total usage? Isn’t the US part of the World?”

Good question – yes it is. When Governor Romney uses carbon emissions from China and the US as criteria for needed efforts to curtail these emissions – what number should he be using – the number per person or the number per country? For me, it is a simple issue of Environmental Justice – every person is equal in his or her right for economic development, and comparisons should be based on people, not countries.

Posted in Climate Change | Tagged , , , , , , , , , , , | 7 Comments

Tackling Environmental Justice: a Global Perspective.

In a previous blog (November 5) I wrote about Governor Romney’s response to a direct question from ScienceDebate about his thoughts on Climate Change. The elections are now over, but the issues are still with us. I want to discuss here one important and very relevant aspect of his response. I am quoting it below:

The reality is that the problem is called Global Warming, not America Warming. China long ago passed America as the leading emitter of greenhouse gases. Developed world emissions have leveled off while developing world emissions continue to grow rapidly, and developing nations have no interest in accepting economic constraints to change that dynamic. In this context, the primary effect of unilateral action by the U.S. to impose costs on its own emissions will be to shift industrial activity overseas to nations whose industrial processes are more emissions-intensive and less environmentally friendly. That result may make environmentalists feel better, but it will not better the environment

This statement needs to be analyzed carefully, because it holds the key to offering a solution. A year ago (last October) the World population surpassed 7 billion; when I was born in 1939, the world population was about 2 billion. The median UN estimate for 2050 predicts a global population of 9.2 billion, with about 85% of the people residing in what we identify now as developing and less developed countries (this includes China, as singled out by Governor Romney) (Science 333, 540 (2011)).

Here are the 2008 relevant data for China and the US: Carbon Dioxide emissions (in thousands metric tons) – China – 7.031 million; US – 5.461 million; Carbon Dioxide per person (in metric tons) – China 5.3; US – 18; GDP (in current US $) – China – 4.5 trillion; US – 14.2 trillion; GDP per person (US $) – China – 3,414; US – 46,760; GDP growth (in %) – China – 9.6; US – (- 0.4).

I chose 2008, because this was the latest year that World Bank data was available for all the indicators that I chose to post here (I realize that 2008 was the start of a financial crisis in the US and other countries, but not in China).

There is a useful identity that correlates the environmental impacts (greenhouse gases, in Governor’s Romney statement) with the other indicators. The equation is known as the IPAT equation (or I=PAT), which stands for Impact Population Affluence Technology. The equation was proposed independently by two research teams; one consists of Paul R. Ehrlich and John Holdren (now President Obama’s Science Adviser), while the other is led by Barry Commoner (P.R. Ehrlich and J.P. Holdren; Bulletin of Atmospheric Science 28:16 (1972). B. Commoner; Bulletin of Atmospheric Science 28:42 (1972).)

The identity takes the following form:

Impact = Population x Affluence x Technology

Almost all of the future scenarios for climate change make separate estimates of the indicators in this equation. The difference factor of 15 in GDP/Person (measure of affluence), between the average Chinese and average American makes it clear that the Chinese and the rest of the developing world will do everything they can to try to “even the score” with the developed world. The global challenge is how to do this while at the same time minimizing the environmental impact.

The figure below, taken from my book, shows the dependence of the GDP/Person on Energy Use/Person for 26 countries, including both developing and developed countries. The data for this graph were taken from the 2002 CIA World Factbook.

On superficial observation, the dependence in the graph looks linear. Linear dependence indicates that the energy intensity, defined as the ratio of GDP/Energy Use, is constant and independent of the GDP of a country. The energy intensity is a true measure of the efficiency of energy use. The approximate independence of the energy intensity to GDP, directly contradicts the often-heard perception that developed countries use their energy more efficiently than developing countries.

More careful observation shows (Yevgeniy Ostrovskiy, Michael Cheng and Micha Tomkiewicz; “Intensive and Extensive Parametrization of Energy Use and Income in US States and in Global Environments”; International Conference on Climate Change: Impacts and Responses; 12 – 13 July 2012; Seattle Washington) that the energy intensity is weakly dependent on the GDP (inverse square root dependence), not because developed countries are more efficient in their use of energy, but because service starts to play bigger and bigger roles in developed countries and is considerably less energy dependent as compared to heavy industry.

In the next few blogs I will focus on the difficulties in reaching an international agreement on limiting the use of fossil fuel, what China and other developing countries are doing to change their energy use, and how the USA is reacting to these developments.

Posted in Climate Change | Tagged , , , , , , , , , , | 6 Comments

Tackling Environmental Justice: a Local Perspective.

About a week ago, I went to Stony Brook University, where I am collaborating with Prof. Lori Scarlatos from the Department of Technology and Society, in constructing a simulation/game. Its aim is to allow students (and everybody else) to find out how the world would change based on certain key decisions, and then compare the results with the actual world. The simulation/game incorporates 25 autonomous country agents, interacting with a single world entity. Populated with data from the World Bank, British Petroleum, and the US Energy Information Administration, these countries represent 75% of the world’s population, living in both developed and developing countries around the world. The players are the “rulers” of their respective countries and are engaged in their energy management.

To get to Stony Brook, I took the LIRR (Long Island Rail Road) train. On my way (from Brooklyn) I had to change trains twice. I take this trip frequently, approximately at the same departing time and on the same day of the week. On my way, I noticed that the volume of passengers was considerably higher than I used to observe. It might have been completely anecdotal, but my physicist training was trying immediately to correlate it with recent events. I did make an effort to get real data from the MTA (Metropolitan Transportation Authority), which runs the trains, but I didn’t get any response. My immediate next thought was to correlate the volume of passengers with the aftermath of Sandy, which had hit the North East about 10 days earlier and had a major impact on all modes of transportation in the region. One of the longer lasting impacts was the fuel shortage, which forced the governors of New York and New Jersey to ration fuel by imposing odd/even day filling times based on the last digit of cars’ license plates. The order immediately had soothing effects on the length of the lines around gas stations.

My cause/effect association was that people that had difficulty getting gas decided instead to take public transportation. My thinking followed with the “dreadful” and “frightening” thought that such a policy might be considered even in calm times as a possible weapon to fight Climate Change.

About the same time, I read a New York Times (November 9, 2012) article by Casey B. Mulligan titled, “Gasoline Lines are Unnecessary.” The following paragraphs from the article summarize the perspective:

Waiting in line is a waste of time. The people there were certainly not helping bring more gasoline to the region and could instead be helping rebuild or could be productive in other ways.

Economists on the right and on the left agree that market prices – prices that reflect both supply and demand location by location – are much better at allocating scarce resources in extreme situations like the storm’s aftermath. But state and local government regulations, in the form of antigouging laws, effectively outlawed market pricing.

If officials had allowed the price system to work, it would have alleviated lines in a number of ways. As suppliers seek the maximum profit, temporary and extraordinary prices encourage them (and make it affordable for them) to go to extraordinary lengths to get the electricity and fuel needed to have gasoline available to customers where it is needed the most.

Were they permitted, high prices would also have encouraged customers to economize creatively on their usage and acquisition of gasoline. If it had cost $10 or $15 a gallon, some people on those lines might have been willing to delay vehicle usage, leaving more for people who were willing to pay that price or who had no other choice.

The net result from both mechanisms to shorten the gas lines should have produced similar outcome. The makeup of the affected populations, however, would have been different. In the first case, people that didn’t want to be bothered with detailed planning and that could freely choose between public transportation and driving, would have shifted to public transportation. In the second case, people that couldn’t afford to pay the higher gas prices, would have had to shift regardless of planning.

The EPA (Environmental Protection Agency) defines Environmental Justice as:

Environmental Justice is the fair treatment and meaningful involvement of all people regardless of race, color, culture, national origin, income, and educational levels with respect to the development, implementation, and enforcement of protective environmental… laws, regulations, and policies.

The policy advocated by Prof. Mulligan is a clear example of environmental injustice.

New York City is at the forefront of urban areas when it comes to formulating policies that are designed to monitor the effects of Climate Change. In 2007, the city launched PlaNYC2030, to coordinate sustainability planning. It combines 25 city agencies, in preparation for population increase, strengthening the local economy  and mitigating Climate Change. As part of this effort, a panel was created to evaluate NYC’s adaptation needs with regards to Climate Change. The report was issued in 2010. My students are now trying to determine how the city is implementing these recommendations. It is a semester long effort that can be followed online.

A quick search of PlaNYC2030’s regard for Environmental Justice issues came up wanting. Recently (August 2012), the New York City Council, with support from the Mayor, recognized this omission. In response, they voted in favor of a new bill that would enlarge the purview of the Climate Change Panel and the Climate Change Task Force to focus not only on infrastructure development, but also on populations that are especially vulnerable to extreme weather events – such as the elderly, children and the poor. That legislation also makes the Panel and the Task Force permanent.

In the next blog I will try to show that dealing with Environmental Justice issues on a global scale is not only the right thing to do but is also the key to finding solutions to these problems that affect us all.

Posted in Climate Change | Tagged , , , , , , , , , , , , , , | 1 Comment

Man’s Power Versus Nature’s Power: the Wrong Distinction

I wrote this blog on Wednesday: immediately following the election, a full week after Sandy (I live in NYC – we’ve been trying to fix some of the damage) and in the middle of a new Northeaster that was dumping snow all around me. In the most recent iteration of the battle between “old white men” and the “world,” the “world” won – but just barely. The “world” here specifically includes both the majority of countries outside the United States, which have overwhelmingly supported President Obama (with two notable exceptions: Israel and Pakistan), and the non- “old white men” in the USA (for details see NYT front page November 8). I am an “old white man.” I voted for Obama, but I still don’t break the stereotype – I speak with a foreign accent.

The coincidence of timing between Sandy and the election might have helped Obama, but the most popular reaction that I have heard was focused on the contrast in human power: how powerless we are when confronting Mother Nature, and in contrast, how powerful we are when deciding who will lead us and “solve” some of the most pressing issues on our collective (perhaps global) mind.

Questions were raised as to the insignificance of the issues that we are being called to vote on, when compared to the fury and misery that nature can and does inflict.

Such a contrast in the scope of issues was on my mind in another important occasion. In my younger days I was a soldier on active duty, fighting in a real war; one we viewed as an existential war, especially before the fighting actually started. At that time there was a break in the activities that was used by families for a field visit. My wife came and we started to chat about what was happening in our circles back home. I still remember the disconnect that I felt at the time: how could we worry about these “trivialities” compared to the life and death situations that we were all facing. It didn’t take me long to remind myself that the two coexisting scales of concern were equally real, and that I had better pay attention to both of them, or risk losing both. The visit ended smoothly. I am sure that many veterans that are now, or have recently returned, from a war zone, have experienced a similar disconnect, followed by a similar return to equilibrium.

I can think of three main ways to correlate policy initiatives with mitigation and/or adaptation to extreme weather conditions such as hurricanes:

1. I had a class on Election Day and we were discussing some of these issues. One student showed me a newspaper article with two keywords: “Bill Gates” and “Hurricane.” It caught his attention because Bill Gates was trying to patent a way for humans to fight hurricanes. I had never heard of this attempt but I was curious about this new suggestion to geo-engineer the planet.

Simplified models of the working of hurricanes present them as heat engines that operate between the warm temperature of tropical oceans and the much cooler temperature of the upper atmosphere. They derive their energy from the latent heat of condensation of water. The remedy proposed by Gates et al was to simply pump the deeper cooler water to the surface. This would reduce the surface temperature and thus mitigate the storm. Sounds fine. It makes sense that if hurricanes operate as heat engines between the warm ocean water and a cooler upper atmosphere, the temperature of the water becomes an important factor in its magnitude. Indeed, usually when the hurricane reaches land or moves to cooler water it loses much of its intensity. The problem is that a quick calculation reveals that the energy that a major hurricane stores approaches 200 times the global electric generating capacity. This, in addition to the uncertainty of predicting the storm’s track, would make such an effort challenging.

2. One major impact that has come out in all the recent computer models is the increasing frequency of extreme storms. Since it has also been agreed upon that extreme storms have been around since before human influence on the chemistry of the atmosphere was noticed, it is very difficult, and probably impossible, to determine how much direct human influence can account for in any given weather event. People are trying to do that, and they will probably try even harder in the aftermath of Sandy. They might even come out with some numbers (these might be important for future lawsuits that request compensation from oil companies). Statistical techniques such as the one that was recently published by James Hansen et al show that the frequency of extreme events, whatever their cause, is on the rise. Once Sandy was on the move, an intense debate surfaced over all the communication channels – could Sandy be blamed on climate change, or was it “natural?” One can follow some of this debate in a condensed series of blogs by Andrew Revkin, the New York Times blogger of Dot Earth, which took place over the week between Sandy and Election Day. One of these blogs hit the mark. The title was “On Sandy and Humanity’s ‘Blah, Blah, Blah Bang’ Disaster Plans” and the first two paragraphs state the following:

For millions of people in the New York metropolitan region and adjacent areas flooded, scorched, and pummeled by the extraordinary hybrid storm once known as Sandy, arguments about how much of the storm’s ferocity was human-created are secondary.

Arguments about how to discuss such extreme events in the context of climate policy — while important — are down the list, as well, even with a presidential election days away. After all, that debate is perennial. (Go here for a valuable 2009 discussion of this question in relation to climate change and African megadroughts; plug in hurricanes where you see drought and the pattern will feel familiar.)

Whether “natural” or man-made, adaptation needs to accommodate the increasing frequency of these occurrences. The main issue, as I mentioned in a previous blog (September 24), is that without an effective mitigation policy, the average weather will become extreme— unfit for human habitation.

3. Adaptation: as was mentioned by Mario Cuomo, the Governor of New York, when what should be a hundred-year storm shows up every two or three years – we need to be prepared. We have examples to follow from places that are more vulnerable than New York City: The Netherlands, Post Katrina New Orleans, etc. It is expensive!!

My undergraduate class at Brooklyn College has a class research project to evaluate what New York City can actually do to implement an adaptation policy for climate change that was drafted and published more than two years ago. I will keep you posted on their results.

All three responses are expensive and will require rethinking of policy priorities. Some of them are more practical than others. Doing nothing is also an option, however, as Sandy is showing (so far estimated at 50 billion dollars), this option has its own costs.

Posted in Climate Change | Tagged , , , , , , , , , | 14 Comments

Global Warming and Energy Independence

I have no idea who will win the presidential election tomorrow. The fact is that climate change went almost unmentioned in both campaigns, and was not discussed at all in any of the three presidential debates. Some blame the moderators for thinking that the topic is not a priority for voters, and therefore not raising the issue, but the silence regarding science in the debates didn’t come from a lack of opportunities to raise the issue. As John M. Broder mentioned (New York Times – October 26, 2012) in his The Agenda article titled “Both Romney and Obama Avoid Talk of Climate Change”:

Both President Obama and Mitt Romney agree that that the world is warming and that humans are at least partly to blame. It remains wholly unclear what either of them plans to do about it.

Such a statement needs some support. I have summarized the candidate’s positions, based on their convention speeches and direct responses to a pointed question from ScienceDebate in a previous blog (September 17). The most direct support can be found in the candidates’ responses to the ScienceDebate question, which was re-published in the Scientific American. I will repeat relevant segments here:

2. Climate Change. The Earth’s climate is changing and there is concern about the potentially adverse effects of these changes on life on the planet. What is your position on cap-and-trade, carbon taxes, and other policies proposed to address global climate change—and what steps can we take to improve our ability to tackle challenges like climate change that cross national boundaries?
Barack Obama: Climate change is the one of the biggest issues of this generation, and we have to meet this challenge by driving smart policies that lead to greater growth in clean energy generation and result in a range of economic and social benefits. Since taking office I have established historic standards limiting greenhouse gas emissions from our vehicles for the first time in history. My administration has made unprecedented investments in clean energy, proposed the first-ever carbon pollution limits for new fossil-fuel-fired power plants and reduced carbon emissions within the Federal Government. Since I took office, the U.S. is importing an average of 3 million fewer barrels of oil every day, and our dependence on foreign oil is at a 20-year low. We are also showing international leadership on climate change, reaching historic agreements to set emission limits in unison with all major developed and developing nations. There is still more to be done to address this global problem. I will continue efforts to reduce our dependence on oil and lower our greenhouse gas emissions while creating an economy built to last.   Mitt Romney: I am not a scientist myself, but my best assessment of the data is that the world is getting warmer, that human activity contributes to that warming, and that policymakers should therefore consider the risk of negative consequences. However, there remains a lack of scientific consensus on the issue — on the extent of the warming, the extent of the human contribution, and the severity of the risk — and I believe we must support continued debate and investigation within the scientific community. Ultimately, the science is an input to the public policy decision; it does not dictate a particular policy response. President Obama has taken the view that if global warming is occurring, the American response must be to slash carbon dioxide emissions by imposing enormous costs on the U.S. economy. First he tried a massive cap-and-trade bill that would have devastated U.S. industry. When that approach was rejected by Congress, he declared his intention to pursue the same course on his own and proceeded through his EPA to impose rules that will bankrupt the coal industry.Nowhere along the way has the President indicated what actual results his approach would achieve — and with good reason. The reality is that the problem is called Global Warming, not America Warming. China long ago passed America as the leading emitter of greenhouse gases. Developed world emissions have leveled off while developing world emissions continue to grow rapidly, and developing nations have no interest in accepting economic constraints to change that dynamic. In this context, the primary effect of unilateral action by the U.S. to impose costs on its own emissions will be to shift industrial activity overseas to nations whose industrial processes are more emissions-intensive and less environmentally friendly. That result may make environmentalists feel better, but it will not better the environment.

There is an intrinsic contradiction here that needs further explanation. The contradiction is embedded in the last quoted paragraph in Mr. Romney’s approach:

The reality is that the problem is called Global Warming, not American Warming… Developed world emissions have leveled off while developing world emissions continue to grow rapidly, and developing nations have no interest in accepting economic constraints to change that dynamic.

From here, both candidates have been very vocal about their commitment to use every resource at their disposal to pursue future plans not for a global shift from fossils to renewable and/or nuclear, but instead to ensure American energy independence.

For me, the most disturbing aspect of this strategy came during the second debate, and it came from President Obama:

MS. CROWLEY (the moderator): I — OK. We’ll — you certainly will have lots of time here coming up. I — because I want to move you on to something that — sort of connected to cars here, and go over — and we want to get a question from Philip Tricolla.

Q: Your energy secretary, Steven Chu, has now been on record three times stating it’s not policy of his department to help lower gas prices. Do you agree with Secretary Chu that this is not the job of the Energy Department?

PRESIDENT OBAMA: The most important thing we can do is to make sure we control our own energy.

So here’s what I’ve done since I’ve been president. We have increased oil production to the highest levels in 16 years. Natural gas production is the highest it’s been in decades. We have seen increases in coal production and coal employment.

The debate went on to explore what Obama did or didn’t do to further US independence of its energy supply. If Climate Change is a global issue, why is pursuing energy independence the answer? One of the most disturbing aspects of the President’s reply to this question was not that he didn’t answer the question, but that he didn’t even mention Secretary Chu in his response. The President forgot that Secretary Chu, a physicist and a Nobel Laureate, works for him, and that it’s his job to execute the President’s policy. This omission stood up in another context in this debate – the President’s response to a question about the recent killing of four Americans in the American Consulate in Benghazi, Libya:

PRESIDENT OBAMA: Well, let me, first of all, talk about our diplomats, because they serve all around the world and do an incredible job in a very dangerous situation. And these aren’t just representatives of the United States; they’re my representatives. I send them there, oftentimes into harm’s way. I know these folks, and I know their families. So nobody’s more concerned about their safety and security than I am.

The President continues on this issue:

And when it comes to this issue, when I say that we are going to find out exactly what happened, everybody will be held accountable, and I am ultimately responsible for what’s taking place there, because these are my folks, and I’m the one who has to greet those coffins when they come home, you know that I mean what I say.

Why American diplomats are his representatives and Secretary Chu is not, remains unanswered. The President knew that the energy secretary was referring to two issues in the statements mentioned: that gas prices are determined by international oil prices, in which the federal government plays a minor role, and that the government’s principal tool for shifting demand to more sustainable energy sources is to increase the price of fossil fuels. Price increase of gasoline, aimed at encouraging a reduction of its consumption, is one of the main available policy tools. The President, however, decided not to mention any of this.

As I wrote this blog, Sandy came and went, leaving a great deal of damage in its wake. Anthropogenic climate change resurfaced in the public consciousness, along with its predictions of the increased frequency of extreme events. I have no idea how long this renewed interest will last, or whether it will be followed by concrete actions. To a degree, this will depend on the choices that we make tomorrow.

Posted in Climate Change | Tagged , , , , , , , , , , | 2 Comments

The Limit to Growth – The Two Shades

I was scanning the internet, trying to find other advocates for what I have recently started to call the 4th Industrial Revolution (October 22) — a revolution that will be fueled by sustainable energy sources, replacing the ones that pollute the atmosphere and cause unsustainable climate change with catastrophic effects. I came across a blog titled “Our Finite World,” run by Gail Tverberg. The blog strongly reminded me of my own blog in its mission to save the world from its own mindlessness, through the use of the educational system. A long comment on that blog redirected my attention once again to M. King Hubbert. I have mentioned Hubbert in my book and in my previous blog, but only in the context of his detailed calculations of the available oil resources in the USA and the emergence of the now famous Hubbert peak. This peak depicts these resources in the form of a bell-shaped curve, or as I called it in my previous blog, a wavelet. In terms of the US reserves, the Hubbert peak is in agreement with future estimates.

The blog has refocused my attention to other parts of Hubbert’s work, which focus on longer-term issues of what to do about the projected decline of these reserves.

In one aspect, Hubbert agrees with Robert J. Gordon’s analysis, in terms of the uniqueness of the present. In his 1962 very detailed report titled “Energy Resources,” submitted to the Committee on Natural Resources, he was trying to extend his Hubbert Peak analysis both backward and forward, 5000 years. The result of this analysis is shown in Figure 1.

Figure 1

This was not the end of the story, either in that report or in his later writings.

Figures 2 and 3 were taken from a short paper titled “Exponential Growth as a Transient Phenomena in Human History,” that was published in 1976 as part of a collection to celebrate the United States’ 200th birthday.

Figure 2- Three types of growth (Hubbert, 1974)

Figure 3- Human affairs in historical perspective from 5,000 years in past to 5,000 years in future (after Hubbert, 1962)

Both figures include various future scenarios, which are clearly marked in Figure 3.

Here is Hubbert’s definition of the three scenarios, taken from the 1962 report that describes an earlier version of these scenarios:

Today, one can obviously argue about the role nuclear energy plays in Hubbert’s scenarios. His words can be repeated today and redefined as the 4th Industrial Revolution. While climate change didn’t actually play any role in Hubbert’s analysis, he would have been justifiably alarmed to have a front row seat watching us expedite the time scale needed for implementation of this revolution.

Posted in Climate Change | Tagged , , , , , , , , , , , | 13 Comments

Limit to Growth – Again?

The reason that I am writing this series of blogs is to try to do whatever I can to prevent what I previously called a “Self Inflicted Genocide” (April 22); one, which in my opinion, and that of many others, will result from the continued and intense reliance on fossil fuels. The consequence of the use of these fuels is to trigger a change of atmospheric chemistry, which in turn results in climate change.

The B1 scenario (September 24October 8 blogs) that will keep the climate bounded at a level in which adaptation has a chance to be effective, requires a major shift in the energy sources that we use. I, among others, have labeled this shift a global energy transition, or a major feeding transition.

As I was going through this process, I came across a New York Times blog (October 15) written by Thomas B. Edsall, titled, “No More Industrial Revolution?” The blog was in a section called “Campaign Stop” that was designed to address issues in the current presidential election. One of the main issues being addressed by both presidential candidates is the ability to stimulate the American economy to create millions of new jobs and significantly reduce the present unemployment rate.

Mr. Edsall was focusing our attention on a recent article by Robert J. Gordon (September 11, 2012) that was published in the National Bureau of Economic Research and reprinted in VOX under the title “Is US Economic Growth Over? Faltering Innovation Confronts the Six.” A paragraph from this paper summarizes the main thrust:

The analysis in my paper links periods of slow and rapid growth to the timing of the three industrial revolutions:

IR #1   (steam, railroads) from 1750 to 1830;

IR #2   (electricity, internal combustion engine, running water, indoor toilets, communications, entertainment, chemicals, petroleum) from 1870 to 1900; and

IR #3 (computers, the web, mobile phones) from 1960 to present.

It provides evidence that IR #2 was more important than the others and was largely responsible for 80 years of relatively rapid productivity growth between 1890 and 1972.

Once the spin-off inventions from IR #2 (airplanes, air conditioning, interstate highways) had run their course, productivity growth during 1972-96 was much slower than before. In contrast, IR #3 created only a short-lived growth revival between 1996 and 2004. Many of the original and spin-off inventions of IR #2 could happen only once – urbanisation, transportation speed, the freedom of women from the drudgery of carrying tons of water per year, and the role of central heating and air conditioning in achieving a year-round constant temperature.

The “conclusion” he comes to is that we are through with industrial revolutions that have a lasting positive effect on the economy and, to use Edsall’s expression, since the US economy is now running on empty, we had better get used to a stagnating economy. That this blog showed up in the “Campaign Stop” section is highly significant because it essentially implies that at least on this important issue, both campaigns are running on empty.

The limit-to-growth argument is obviously not new. Googling the term produces 300,000 links. Its origin can arguably be traced to Robert Malthus (1766 – 1834), who based his argument on the need to adjust exponential growth of population with linear growth of food supply. Since Malthus’ time, there have been many arguments and counterarguments that trace the limits to limited availability of natural resources. Given M. King Hubbert’s analysis of availability of oil in the US, I try in my book to analyze Malthus’ argument in terms of energy source availability. Gordon’s article is the first indication that I am aware of that the threshold will be determined by the limits to human ingenuity.

I am a physicist (actually I was trained as a chemist and gradually moved into physics in my research on alternative energy sources that was focused on semiconducting materials). I will not try to argue with Prof. Gordon on the quality of data that he is using to draw his conclusions, but I will try to make the case that at least in terms of what is needed, we had better have a fourth industrial revolution to shift our energy sources to a more sustainable mix (and soon!). Considering the fact that more than 25% of the human population lives without electricity (October 1) and that the average US GDP/Capita is about an order of magnitude higher than the global average, such a shift can not come without growth. And indeed, all the SRES scenarios (September 24) that the IPCC is relying on, stipulate major global economic growth.

I would like to argue one important element of Prof. Gordon’s analysis: The definition of the first industrial revolution (IR#1) is much more appropriate in terms of the beginning of the use of coal as a low cost and efficient way to run the newly improved steam engines and their subsequent use in mechanizing the British textile industry.

The Industrial Revolution is much better defined in terms that are analogous to the financial bubble that we have just experienced by relying on borrowed money for economic growth.

We started to use solar energy that was stored on earth for millions of years through the decay of dead greenery and animals under limited supply of oxygen. This energy is stored in a “warehouse” (planet Earth) and it took the industrial revolution for mankind to be smart enough to find it and use it for present needs. As in any retrieval process, the warehouse stock will eventually run out unless replenished. However, our main concern is not running out of energy sources so much as it is the “high interest” we must pay as a result of our current usage: the “waste” products that we generate by using fossil fuels change the energy balance with the sun, and result in major climate change. In this sense IR#2 and IR#3 are both derivatives of IR#1, which pioneered the use of fossil fuels to power machines that are doing work for us.

Just as our current financial crisis was fueled, in large part, by relying too much on borrowed money, the industrial revolution was “fueled” by “borrowing” fossil fuels from warehouse Earth. We were able to draw great benefits from fossil fuels but we are now starting to pay the interest.

I think that Prof. Gordon is right in arguing that the period of 1750 – 2100 can be represented as a wavelet in human history. But I don’t think that he is right to present it as a wavelet in economic growth; it’s a wavelet in using borrowed energy.

What we now need to do is to stop borrowing so heavily from Earth’s energy warehouse and figure a way to continue economic growth by developing and using more sustainable energy sources. In any interpretation, the wavelet includes two sides: past and future. The past is based on data, while the future is based on scenario, and depends on our choices. In my next blog I will try to elaborate on the available choices.

Posted in Climate Change | Tagged , , , , , , , , , , , , , , , , , | 8 Comments

A Voice From the Inside of a Feeding Transition

In the last few blogs (September 24 October 8), I have tried to make the case that we can aim for a reasonable global strategy based on the IPCC SRES B1 scenario.  This calls for limiting anthropogenic changes to the chemistry of the atmosphere to a degree that is manageable through adaptation. The B1 scenario is based on two fundamental anchors, both reliant on a timeline which culminates toward the end of the century: limiting and stabilizing the global population to below 10 billion people and a major transitioning of global energy toward reliance on non-fossil fuel sources, such that more than half of all global energy comes from alternative sources (up from the present 15%). I and many others, have labeled this sort of major shift in energy supply over such a short time, a “feeding transition.” Obviously, both transitions have major consequences. In our limiting and stuttering ways we are in both transitions now and many of the consequences are already visible.

October 2011 marked a milestone, as the global population passed the 7 billion mark. Science magazine used this landmark as an opportunity to publish a full issue dedicated to present trends in global population (Science 333, 29 July 2011). Figures 1 and 2, posted below from the Science issue, are based on data from the UN Population Division.

Figure 1

Figure 1 shows the history of global population throughout human history. When I was born, the global population was just above 2 billion people. During my lifetime, the global population has grown by an additional 5 billion people; such is the power of exponential growth. Growth of this magnitude has environmental consequences, as we are now a major part of the physical environment (June 25 blog).

Figure 2 shows the more recent trends in global fertility rates, as defined by the average number of children that would be born to a woman during her lifetime. The fertility rate is the ultimate driving force for population growth, with a replacement rate taken as a number between 2 and 2.5 depending on factors such as infant mortality rate. One can see a major decrease in fertility rates after 1975. In most developed countries the total fertility rate is now well below replacement and the population is decreasing. The fertility rate in developing countries is still well above replacement but it is fast declining. This trend underlines the B1 scenario for a global population projected to stabilize below 10 billion toward the end of the century. This trend has also major consequences that we are presently experiencing, some of which I will try to explore in a future blog.

Figure 2

The part of the B1 scenario that deals with energy use is a more complicated situation. Globally, we have started to pay attention to the ways that the use of fossil fuels exert stress on the chemistry of the atmosphere. In the Rio convention (June 1992), the framework was established in an attempt to construct a global energy system that would reduce the carbon footprints while at the same time not limiting economic growth. The UN Framework Convention on Climate Change (UNFCCC) was created to form a global framework for collective action. On February 16, 2005, upon ratification by a set of countries collectively responsible for 55% of the greenhouse gases (GHG), the Kyoto Protocol came into force. Participating parties from developed countries were committed to reducing their combined GHG emissions by at least 5% from the 1990 level by the period of 2008 – 2012 and were to show significant progress in achieving that goal by 2005. The most notable exception to this ratification was the United States, which decided after the 2000 elections, not to be a part of the protocol. In contrast, the European Union was perhaps the most fervent supporter of the agreement, implementing Cap and Trade policies that shifted the cost balance between fossil fuels and alternative energy sources.

Figure 3 shows the results, as compiled from the International Energy Administration Data (EAD). From 2000 to 2009 both the European Union and the US follow similar patterns of carbon emission, while China’s emissions more than double. Looking back at the original data from the Kyoto baseline of 1990  shows that the European Union is approximately fulfilling its Kyoto commitments while the US (no commitments) slightly increases its emissions (by about 10%).

Figure 3

The emission comparison between the United States and the European Union seems to suggest that changes in government policies, as to use of energy sources, have very little impact, while economic activities certainly have an impact (two recessions over the last decade). The largest influence on the US, however, was a major shift in the primary energy source that drives electricity production.

Figure 4

Figure 4 again shows (October 8) the fuel type of electricity generation capacity by initial year of the operation of the power stations. Since 1990, and especially following the year 2000, the United States has experienced a major energy transition in the form of a shift from coal-based production to natural gas, with significant contribution from wind-fueled energy. While policy had something to do with this shift (primarily with regard to wind production), the main contributors were the market forces of price and technology. Natural gas is a fossil fuel – so it doesn’t bring us closer to the B1 energy transition, but it is the most efficient fossil fuel in terms of delivering energy for a constant carbon dioxide emission.

Figures 3 and 4 show that over the last 10 years we have experienced three major driving forces for energy use. Europe was driven by the Kyoto protocol, and China was driven by the apparent necessity to supply their fast economic growth with locally available, cost effective primary energy (coal). While the United States’ driving force was very similar to that of China, technological innovation uncovered the availability and cost effectiveness of natural gas as a much more efficient alternative to coal. The resulting energy usage happens to follow in the spirit of the Kyoto Protocol, even without having adjusted policies to accomplish this objective. Realization of the B1 scenario requires a global energy shift. If we are aiming for a similar outcome, we must somehow learn from our recent experiences as we determine how best to proceed.

Posted in Climate Change | Tagged , , , , , , , , , , , , , | 6 Comments

Mañana

Mañana is a common expression (derived from Spanish but used much more generally) that translates as tomorrow or in the indeterminate future. It is also the common denominator of my “Three Shades of Deniers” (September 3 blog) that I have previously labeled as “DNNers” (Do Nothing Now: do it, maybe, “tomorrow” or the day after). In the same blog post, I showed one of my test questions, along with my students’ general reaction:

The argument has been made (Dissenting voice in http://climatedebatedaily.com/) that since the projections say that future generations will be much richer than ours, they should pay for the future impacts of climate change. Argue for and against this position.

I don’t ask students to demonstrate any preference, requiring only that they present detailed argument for and against both positions; however, most students show preference against postponing action. The main reason that students provide is that most of the actions possible are time dependent, and the feasibility of remediation quickly decreases the longer we wait.

My student’s response was based mainly on moral grounds: we did it – we should fix it – now!

I would like to add some numbers to further explain and evaluate these options.

I have defined, “Declaration of Victory and Exit Strategy” as follows:

The four figures below illustrate two possible scenarios out of the more than 40 on which the IPCC is reporting. We can declare “victory” and exit the battlefield if toward the end of the century we can derive more than half of our global energy from non-fossil sources, a development that would approximately follow the dynamics of B1 in Figure 4.

In the same blog, I argued that the B1 scenario also requires that the global population stabilize to around 8 billion people as compared to the A2, business as usual, scenario that projects a more than doubling of present global population.  Figure 4 in that blog shows very little difference toward mid-century, both in terms of population growth and fraction of energy sources not derived from fossil fuels. Most of the divergence between the two scenarios shows up after 2050.

An interesting consequence of this analysis is that the primary energy per capita is about the same in the two scenarios, with an increase of about 50% to support the projected increase of the standard of living.

The purpose of this blog is to figure out what it will take to reduce the fraction of energy sources that derive their energy from fossil fuels to be below the required 50%.

Figures 1 and 2 show the age of power plants in the US in terms of the primary energy sources that drive the conversion (http://www.eia.gov/todayinenergy/detail.cfm?id=1830)

Figure 1.

 Figure 2.

Presently (2009), around 1.5 billion people, around the world, lack access to electricity. This number consists of close to 25% of the world population. Almost all of these people reside in developing countries. Yet, both IPCC scenarios (September 24) predict a much higher average global income toward the end of the century. It is a safe assumption that if the high-income predictions come true, there will be close to universal access to electricity. Currently, developed countries already enjoy such full access. Developed countries spend about half their primary energy consumption on electricity generation (the rest goes mainly to transportation and heating), so electricity is a good proxy for the simulation of future energy consumption. However, if we use electricity as a proxy for primary energy use, we have to take in account that electricity is a secondary energy source with a typical conversion efficiency of 30% from primacy energy sources.

Figures 2 and 3 in the September 24 blog show that the present global need of primary energy is about 16.5 TW (trillion watts); the B1 projects the need by the end of the century at 31TW, while the A2 scenario would require twice as much energy. For simplicity, we will assume that all the energy used goes to generating electricity. The non-fossil fraction of present day generation amounts to 2.4TW, which amounts to around 15% of the primary energy used.

The largest power generating stations that include coal, gas, nuclear and wind are about 1GW (billion watts). That does not mean that we have a single wind turbine that generates billion watts; it refers to the wind farm that can consist of few hundreds turbines connected to the transmission network. The largest photovoltaic farm is 0.1GW with the total global photovoltaic capacity (2011) at 64GW. From Figure 2, a “typical” lifetime of an electric generator can be taken as 50 years, so we can estimate the number of generating stations that will be needed before the end of the century to be about 20,000. If we spread this number uniformly over the remaining 90 years, it will require more than 4 1GW stations per week. To achieve the global objective of the B1 scenario – about half of these stations will need to generate the electricity from non-fossil sources. Such a transition requires all the time that we can provide.

For an estimate of the task, we can have another look at Figure 1. The last 10 years have constituted a very large energy transition to natural gas and renewables. This transition is roughly equivalent to 550 1GW power stations.

Next week we will look closer at this transition.

Posted in Climate Change | Tagged , , , , , , , , , , , , , | 3 Comments

Cost Effectiveness

In the previous blog (September 24) I outlined a “victory,” based on IPCC (Intergovernmental Panel on Climate Change) projections, which will allow us to stabilize the composition of the atmosphere at levels that adaptation will be able to handle. I said:

We can declare ‘victory’ and exit the battlefield if by toward the end of the century we can derive more than half of our global energy from non-fossil sources, a development that would approximately follow the dynamics of B1 in Figure 4.

“Victory,” following this analysis, requires that by toward the end of the century, at least half of our energy come from sources that do not change the atmospheric chemistry and thus do not destroy our energy balance in a way that will result in destructive climate change. In the prior two blogs (September 10 and 17), I tried to take advantage of the two political conventions to figure out whether the candidates that are asking for our votes in November are promising to pursue policies that move us closer to that objective.

As we saw, both Governor Romney and President Obama have promised to develop sustainable, alternative (to fossil fuels) energy sources and thus, hopefully, move us in the direction of “victory.” However, there are differences in their approaches, including Governor Romney’s added condition that any alternative energy resources used must be cost-effective. President Obama, meanwhile, has added no such condition.

Here is a summary of the two positions as related to this issue:

Republican Platform:

The current Administration – with a President who publicly threatened to bankrupt anyone who builds a coal-powered plant – seems determined to shut down coal production in the United States, even though there is no cost-effective substitute for it or for the hundreds of thousands of jobs that go with it as the nation’s largest source of electricity generation

We encourage the cost-effective development of renewable energy, but the taxpayers should not serve as venture capitalists for risky endeavors. It is important to create a pathway toward a market-based approach for renewable energy sources and to aggressively develop alternative sources for electricity generation such as wind, hydro, solar, biomass, geothermal, and tidal energy.

Speeches during the convention:

Governor Romney:

And unlike the President, I have a plan to create 12 million new jobs. It has 5 steps: First, by 2020, North America will be energy independent by taking full advantage of our oil and coal and gas and nuclear and renewables.

President Obama promised to begin to slow the rise of the oceans and heal the planet. My promise…is to help you and your family.

President Obama:

We’re offering a better path – a future where we keep investing in wind and solar and clean coal; where farmers and scientists harness new biofuels to power our cars and trucks; where construction workers build homes and factories that waste less energy; where we develop a hundred year supply of natural gas that’s right beneath our feet. If you choose this path, we can cut our oil imports in half by 2020 and support more than 600,000 new jobs in natural gas alone.

And yes, my plan will continue to reduce the carbon pollution that is heating our planet – because climate change is not a hoax. More droughts and floods and wildfires are not a joke. They’re a threat to our children’s future. And in this election, you can do something about it.

The first question to ask is, “cost-effective” relative to what? Why do we feel that we should pay next to nothing for energy and its delivery?  Is it because we feel that it’s somehow our “right” to do what we will with “nature” and that transactions that revolve around energy should be free or very cheap?  We willingly pay huge sums to people for handling our finances, and for many other things.  Why should this be any different?

Country

US Cents/kWh

Year

GDP/Person

(Current $)

(US Cents/MWh)/(GDP/Person)

Argentina

5.74

2006

5,486

1.05

Bulgaria

16.3

2012

7,158

2.28

Brazil

34.2

2011

12,594

2.7

China

9.1

2012

5,445

1.67

France

19.4

2011

42,337

0.45

Germany

27.8

2011

43,689

0.64

India

2.0

2009

1,489

1.34

Malaysia

7.42

2007

6,905

1.07

Mexico

19.3

2012

10,064

1.92

Philippines

30.5

2010

2,140

14

Russia

9.58

2012

13,089

0.73

Sweden

27.1

2011

56,927

0.48

Turkey

13.1

2011

10,498

1.25

United Kingdom

17.8

2012

38,818

0.46

Ukraine

3.5

2011

3,615

0.97

United States

12

2011

48,442

0.25

 Table 1.

Electricity cost as fraction of GDP/Capita in various countries

Table 1 shows the cost of electricity as fraction of the GDP/Capita of various countries. I took most of the electricity prices from a Wikipedia site that includes the primary references. All the GDP data is taken from the World Bank. For some reason or another, India’s data didn’t show up with the rest in Wikipedia, so the rate of Indian electricity was taken from a primary source here instead.

In developed countries, electricity accounts for half of all primary energy usage.  So, electricity rates in those countries are the best indicators of the effects that energy prices have on a both a country’s economy and its citizens’ daily lives.

In most countries, electricity prices are regulated so as to provide the most cost-efficient use. Gasoline prices, on the other hand are subject to various policies that are designed to either encourage or discourage its use. In most countries, high priced gasoline use for vehicular transport often has alternatives in the form of more energy efficient public transportation.

It is not surprising (at least to me) that such an analysis of the cost of electricity shows that the average price of electricity in the United States is the lowest among the countries that are listed inTable 1.

More than that, as a glance at the primary data shows, the 2011 average electricity cost in the United States is 12 Cents/kWh. However, in Hawaii the price is as high as 36 Cents/kWh, while in my own state of NY it is 19 Cents/kWh – way above the average. Hawaii’s income per capita is 97% of the US average, while that of NY is 115% of the US average.

Table 1 also shows that the relative electricity costs in developing countries are significantly higher than those in developed countries. Yet, over the last 20 years most of the developing countries enjoyed much higher GDP growth as compared to most developed countries.

We need to specify the frame of reference when we decide on policies to develop cost-effective energy. Can we focus on research and development of better (and more “cost effective”) energy sources and postpone implementation until we decide that we have reached some limit in improving these devices? In the next blog I will examine the issue of timing.

Posted in Climate Change | Tagged , , , , , , , , , , , , , , , , , , | 1 Comment