Today I am continuing my series (which started October 15th) examining the early signs of the global energy transition. In the previous two blogs my emphasis was on use of primary energy and electricity. This week, I’m looking at coal use. I am still using the same 15 countries, which represent three income levels and together comprise 75% of the global population.
I was utilizing data from the World Bank but this week I have shifted to the British Petroleum (BP) database because the World Bank doesn’t list coal as a separate indicator. As with the previous blogs, I am focusing on changes in coal use from the year 2000 through the most recent data available. In the World Bank database that was for 2014; BP had data through 2018. For the primary energy I used the same World Bank numbers as before, supplementing them with more recent data from BP.
Here I am using the concept of coal intensity, which is defined as the ratio of energy derived from burning coal to the total use of primary energy.
Coal use has become a key issue among those advocating the urgency of an energy transition from fossil fuels to sustainable, zero emissions energy sources.
My October 8th blog covered Germany’s declaration that it will shut down all of its coal power plants within 19 years (by 2038). I mentioned that in almost all cases of commitment to net carbon zero by 2050, the first hurdle is removing coal as an energy source in electrical power delivery. Among the 15 countries that I am analyzing in this series of blogs, only the UK and France belong to the group that has made this commitment. The issue is under discussion in both the European Union in general and Germany in particular.
Most of the countries that have already announced commitments to end their use of coal don’t really rely on it for their electricity production. France is a good example (more than 70% of its electricity comes from nuclear energy). Germany is certainly a large exception to this trend and the October 8th blog summarizes the steps that the country is taking to follow up on its decision.
If one country can claim the “throne” for coal use in its energy policy, it’s China. It now claims more than half of the coal used globally for that purpose. Figure 1 illustrates this trend. The graph shows China’s use of coal as slightly shy of that used by the rest of the world but it ends in 2017. Slightly more updated data from BP shows the country passing the 50% mark.
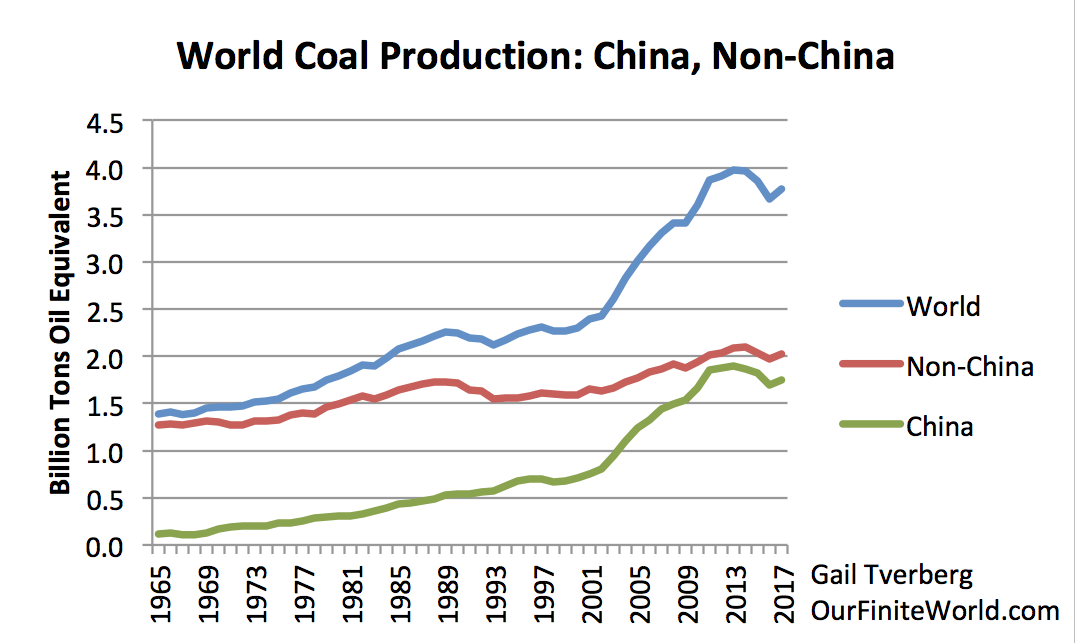
Figure 1 – World coal production
Figures 2-4 show the trend in coal intensity of the three income groups as normalized to global coal intensity.
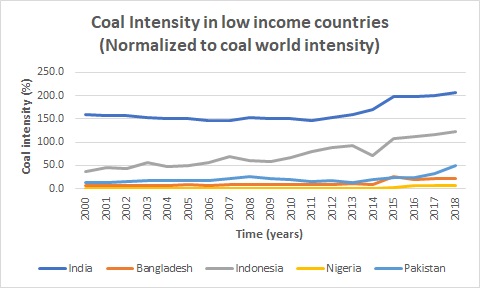
Figure 2 – Coal intensity in low-income countries
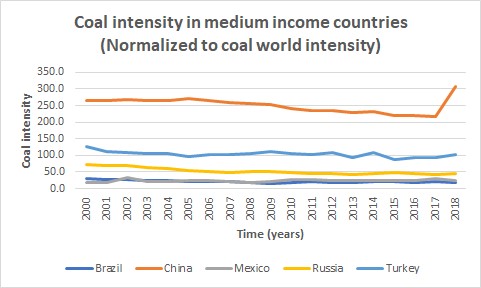
Figure 3 – Coal intensity in middle-income countries
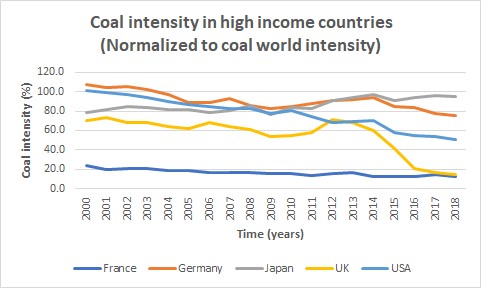
Figure 4 – Coal intensity in high-income countries
Figure 5 shows the changes in world coal intensity over that period.
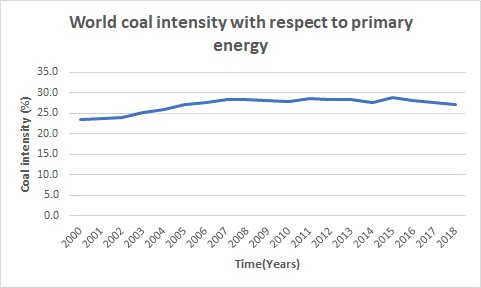
Figure 5 – World coal intensity
Figure 5 demonstrates that the global coal intensity remains approximately constant at around 25% over this period. One can also see that four of the five rich countries, with the exception of Japan, are reducing their coal use (as a fraction of their energy use). Meanwhile, India and China in the other income groups clearly exceed the average global use.
In the next few blogs I will focus on the use of renewable energy and carbon footprints in the same time period and group of countries.
I understand that pooper countries have less resources to use other fuel sources, as coal is abundant and cheap to extract, however China, which has had a tremendous economical growth has no excuse, and better yet it is increasing coal production and use like there is no data supporting its daunting effects. I feel like China is still riding the “poor county” train despite its current wealth and pretends that new money does not come with new responsibility, in this case in the environmental impact.
Thank you for your informative post. “If one country can claim the “throne” for coal use in its energy policy, it’s China. It now claims more than half of the coal used globally for that purpose.” Figure 1 was very helpful in visualizing this statement, as were all the graphs. The abundant amount graphs were very fitting for this post and made it very visually informative.
Why does the global coal intensity remain approximately constant despite the worldwide coal intensity increasing on average?
Why is it harder for lower income countries to reduce their coal intensity (%)?