Two of the last three blogs (July 15 and July 29, 2014) discussed the role that energy storage plays in the transition to more sustainable energy sources. In my last blog, I tried to discuss the available technologies. This week, I will put the emphasis on the economics, while in the next one (assuming that nothing “urgent” interferes), I will focus on the considerations that take place in the selection process of which technologies to apply.
In order to discuss the economics of needed storage, let’s focus on a recent IEA (International Energy Agency) report; it came up with a roadmap for the global storage technologies required in order to accommodate an energy transition aimed at limiting the global temperature rise to below 2oC. The main conclusions of this report are summarized below:
- Energy storage technologies are valuable in most energy systems, with or without high levels of variable renewable generation. Today, some smaller-scale systems are cost competitive or nearly competitive in remote community and off-grid applications. Large-scale thermal storage technologies are competitive for meeting heating and cooling demand in many regions.
- Individual storage technologies often have the ability to supply multiple energy and power services. The optimal role for energy storage varies depending on the current energy system landscape and future developments particular to each region.
- To support electricity sector decarbonisation in the Energy Technology Perspectives (ETP) 2014 2DS, an estimated 310 GW of additional grid-connected electricity storage capacity would be needed in the United States, Europe, China and India. Significant thermal energy storage and off-grid electricity storage potential also exists. Additional data are required to provide a more comprehensive assessment and should be prioritized at the national level.
- Market design is key to accelerating deployment. Current policy environments and market conditions often cloud the cost of energy services, creating significant price distortions and resulting in markets that are ill-equipped to compensate energy storage technologies for the suite of services that they can provide.
- Public investment in energy storage research and development has led to significant cost reductions. However, additional efforts (e.g. targeted research and development investments and demonstration projects) are needed to further decrease energy storage costs and accelerate development.
- Thermal energy storage systems appear well-positioned to reduce the amount of heat that is currently wasted in the energy system. This waste heat is an underutilized resource, in part because the quantity and quality of both heat resources and demand is not fully known.
Focusing on the United States, India, China and the European Union, the IEA calculates the necessary daily capacity for electricity storage and the corresponding investments that are vital to satisfying all of these countries’ energy storage needs in 2050. The data are presented for three different scenarios for capacity building:
- 2DS scenario – this is the baseline scenario where renewable energy technologies are increasing their share of worldwide electricity generation from about 20% in 2011 to about 65% in 2050, with variable renewals supplying 29% of the total electricity produced globally. This scenario corresponds to approximate requirement to limit the global temperature increase to 2oC.
- A “breakthrough” scenario that assumes aggressive reduction in the cost of storage
- “EV” scenario where demand response from “smart” charging of electrical vehicle fleet in the 2DS scenario provides additional flexibility to the system.
The two figures below, marked “figure 7” and “figure 9” (from the original report), show some of the most important aspects of the results.
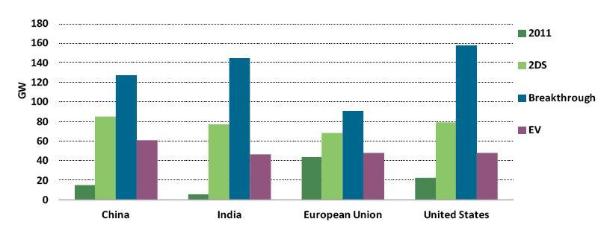
Figure 7: Electricity storage capacity for daily electricity storage by region in 2011 and 2050 for ETP 2014 scenarios
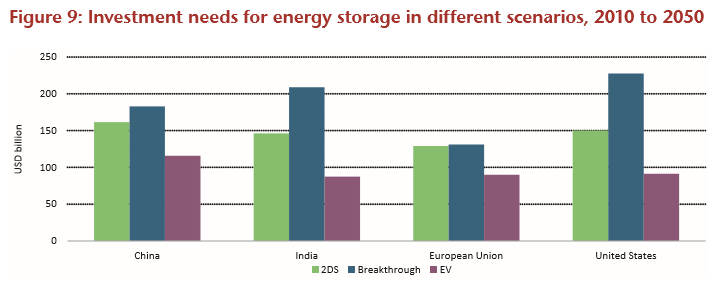 These figures need some brain tutoring enforcements. The second figure is self-explanatory – we all understand how much $1 billion is, and all 4 regions need to spend around $150 billion (each) – based on the 2DS scenario – to satisfy their storage needs, and that constitutes big money. It is worth noting here that the same amount is about 50 times bigger for India than it is for the US and Europe as compared with present GDP.
The units in the first graph are a bit more interesting, so let us try to calculate their significance from first principles: I will focus again on India and the United States. The figure indicates that in 2011, the daily electricity storage in the United States was about 20GW (1 GW = 1 gigawatt = 1 billion watts), while in India that storage was very close to zero on this scale (I will take it to be 1 GW for this calculation). Again, India has much more work to do to get to the 2050 target based on this scenario. In both cases, based on the 2DS scenario, the need will increase to about 80 GW. How significant are these numbers and how can we relate to them based on first-principle calculations?
My data source for most of these kinds of calculations is the World Bank. According to the World Bank, the population of India in 2011 was about 1.22 billion (1.22×10⁹ using Scientific Notation) while that of the United States was 322 million (3.22×10⁸). The electric power consumption that year in the United States was 13,246 kwh/capita (1kwh = 1 kilowatt hour = 1000 watt hours) while that in India was 684 kwh/capita.
This is highly confusing and my editors will start climbing trees claiming that this is rocket science for the “average” reader and I should “simplify.” You are not an “average” reader, though, so let’s try to go through the complexities.
The most confusing thing here should not be the numbers but the units. The figure lists electricity storage in units of billion watts. We know that a watt is not a unit of energy but a unit of power (think of the rating of a light bulb – as 60 watt or a 100 watt). To convert power to energy we have to multiply the power rating by the time that we use it. So when we pay the electric bill we don’t pay for the power but for the energy that we use. When we leave a 100 watt light bulb on for 10 hours we use 100w x 10hrs = 1000 watt-hours = 1kwh of energy. So if we want to calculate the amount of energy in 1 GW of daily energy storage it will give us 1 billion watts x 24hrs = 24 gigawatt-hours of energy/day, the needed energy storage for the United States in 2011 is 20GW = 24×20 gigawatt-hours/day = 480 gigawatt-hours/day.
According to the World Bank, the average energy consumption in the United States in 2011 was 13,246 kwh/capita. We need to multiply this number by the US population in 2011 to get the total electricity consumption for that year. This results in 4.3×10¹³ kwh/year (try it!). We then divide this number by the number of days per year to get 11.8 billion kwh/day = 11,800 gigawatt-hours/day.
The needed energy storage for the United States in 2011 is 480/11,800 = 4% the average electrical energy consumption for that year.
A similar calculation of India’s data produces 684 kwh/capita x 1.22×10⁹ people = electric energy consumed in 2011 = 834 billion kwh/year or 2.4 billion kwh/day = 2400 gigawatt-hours/day. The present storage requirement based on 1GW is 24 gigawatt-hour/day. So the Indian storage requirement amounts to only 1% of their daily use of electricity.
Based on the 2DS scenario the projected storage requirements in the US in 2050 will increase 2.5 fold from today’s figures, while those of India will be 50 times larger. These are enormous numbers that present both massive challenges and equally large business opportunities. People all over the world are beginning to realize that.
* I always welcome questions and comments about my blog, my book, and my work in general. Unfortunately, I have been deluged with spam – both in the comments section here, and in my email. In the interest of spending my time addressing actual messages (instead of sorting through junk), I ask that you please send any questions to one of the following addresses, with the title, “Comment about CCF blog.”
micha (no space) tom (at) brooklyn (dot) cuny (dot) edu
or info (at) lcgcommunications (dot) com. Thank you for your continued readership and your feedback.