Two years ago (June 18, 2019), I discussed higher-education carbon emissions. This included the lists that organizations such as the Sierra Club made to rank campuses across the country by their emissions. We split emissions into three categories:
Scope 1 – Direct emissions from owned or controlled sources
Scope 2 – Indirect emissions from the generation of purchased energy (exclusively targeted at electricity)
Scope 3 – All indirect emissions (not included in Scope 2) that occur in the value chain of the reporting company, including both upstream and downstream emissions
Scope 3 is an essential category because carbon emissions—and human behavior in general—are not always neatly packaged into easily measured organizations such as college campuses or large buildings. It includes other major emissions contributors such as driving and flying.
Lately, I have used my blogs to explore the new NY laws that legislate carbon emissions in large buildings, including the timelines they establish for emissions reduction in these buildings and their fines for noncompliance. I looked at how they measure these emissions through energy use, keeping track of the characteristic carbon intensity specific to various energy sources. Last week, I focused on Scope 1 emissions, using natural gas as an example. Today’s blog continues this effort by extending the discussion to electricity use. It’s a much more complicated aspect than the Scope 1 calculation but it is key to successful mitigation of anthropogenic climate change. I have repeatedly discussed (You can put “electricity use” into the search box here to find my relevant blogs) how the shift from direct Scope 1 energy use to electricity use is one of the most important indicators of the current energy transition (think of electric cars as an example).
Let’s start the discussion with a relatively simple target that ties into last week’s blog. Last week, I looked at the carbon emissions from natural gas; this week, I’m looking specifically at the emissions from natural gas that is used exclusively to drive electricity generation. Table 1 shows data from the EIA (Energy Information Administration).
Table 1 – CO2 emissions from US electric power production
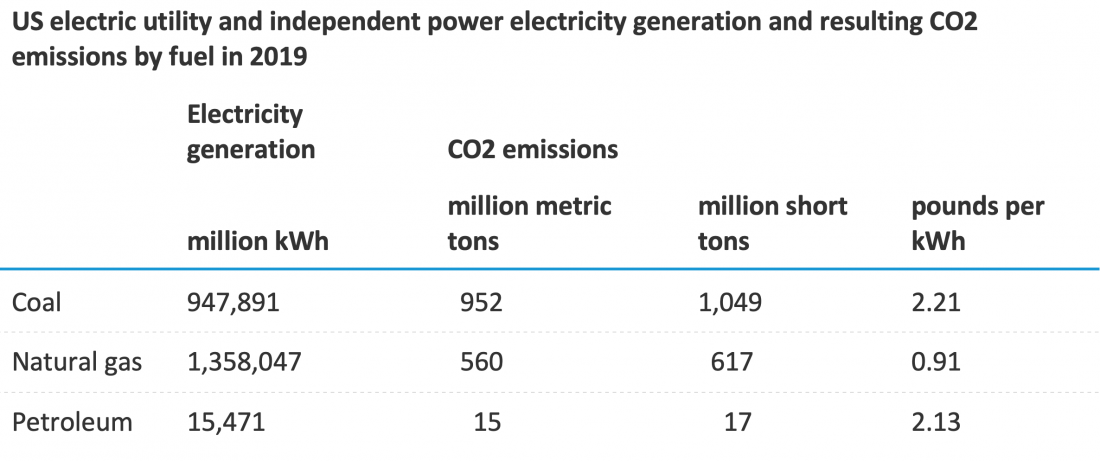
The first thing to notice in Table 1 is the units. Instead of the kg of CO2/ kbtu of energy that I have used in previous blogs, the EIA provides the data in pounds per kWh. As with last week, I will focus here on natural gas, converting the units so that we can compare the results with the corresponding values in Table 2.
In 2019, the carbon intensity of the CO2 emissions from the US burning natural gas to produce electric power was 0.91 lb/kWh. We convert that in the following way:
0.91(lb/kWh)*(0.45kg/1 lb)*(1 kWh/3.413 kbtu) = 0.12 kgCO2/kbtu
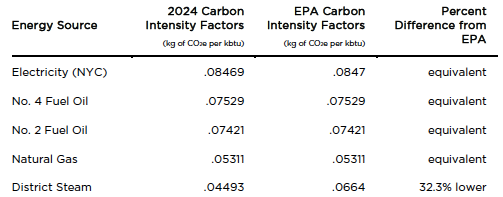
Now that we have a shared set of units, we can see that in 2019, in the process of producing electricity, the US emitted more than double the EPA’s target carbon intensity value in Table 2 (a value that we confirmed in last week’s blog, based on first-principle chemistry).
Table 2 – Carbon intensity factors
The reason for this major change in carbon intensity is that electricity is not a primary energy source; it is a secondary energy source. The power companies use Scope 1 primary energy to produce heat that runs a turbine, which actually produces the electricity (and creates Scope 2 emissions). This process cannot run at 100% efficiency. I went into depth on this particular conversion in an earlier blog (October 22, 2019). The Energy Information Administration (EIA) gives secondary energy another name: “heat rate” —that is, the amount of heat generated by the primary energy source that is needed to produce a given amount of electricity, as expressed in kWh.
The EIA provides an explanation, with a couple of examples:
To express the efficiency of a generator or power plant as a percentage, divide the equivalent Btu content of a kWh of electricity (3,412 Btu) by the heat rate. For example, if the heat rate is 10,500 Btu, the efficiency is 33%. If the heat rate is 7,500 Btu, the efficiency is 45%.
Figure 1 shows that there have been some recent changes in the conversion efficiency within the three main fossil fuels that power companies use to generate electricity.
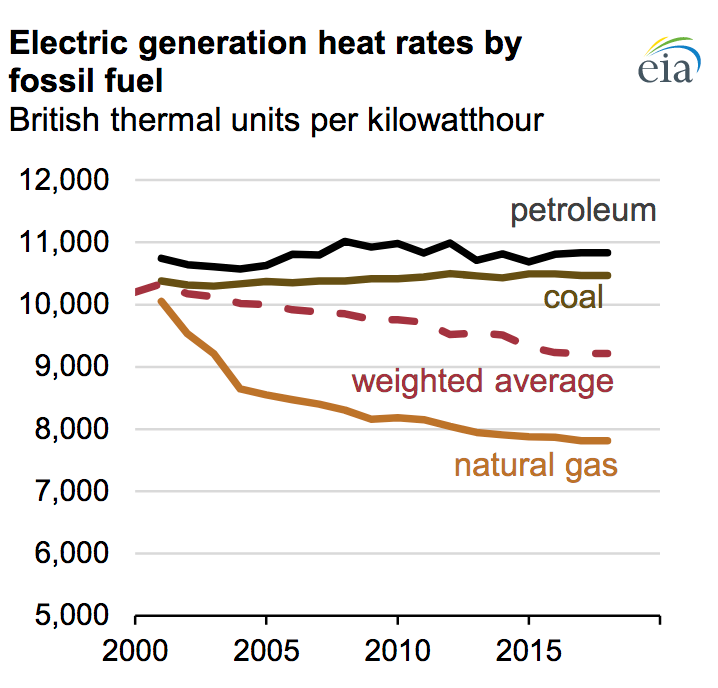
Figure 1
We can see that—while there is almost no change in efficiency for coal or petroleum, there has been a major change with regards to natural gas. The main driver of natural gas’ improved efficiency is the increased temperature of the conversion.
Next week, I will narrow these considerations to my local environment in NYC.
Great analysis, climatechangefork! Your explanation of Scope 1, 2, and 3 emissions makes electricity’s carbon impact much clearer. Really helpful for understanding energy transition and efficiency improvements.