I have used Table 1 in the last few blogs (starting on May 11th) to show the carbon intensities for the various sources of energy that we use in large buildings (greater than 25,000ft2) in NYC. From there, I’ve shown how to convert that energy use to carbon footprints, which are important because a new law mandates that they decrease significantly over the next few years.
Table 1 – Carbon intensities used in NYC to calculate carbon footprints
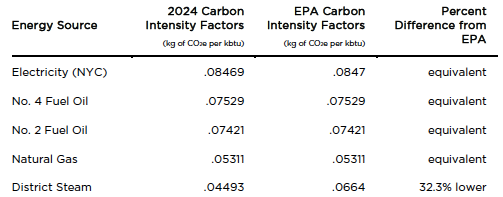
I used first principles from elemental chemistry to calculate the carbon intensities for Scope 1 fuels, such as oil and gas. Last week, I showed that the process of calculating these data for electricity is more complicated. Electricity is Scope 2 energy, meaning that it has to be converted from chemical energy (in this case, by our utility companies) before we can use it. Physics tells us that this conversion cannot run at 100% efficiency. When NY counts our carbon footprints, it does so by measuring the carbon emissions that our utility generates in order to supply us with electricity.
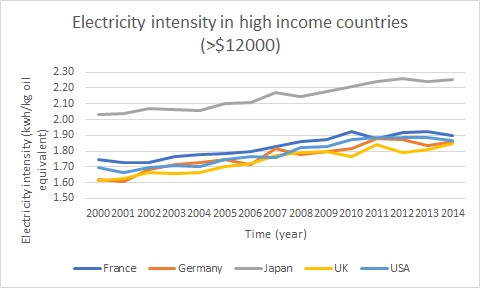
The distinction between Scope 1 fuels and electricity is important because the conversion process is one of the most important indicators in this energy transition we are going through (October 15, 2019). Figure 1 demonstrates the electricity intensity for developed countries like the US. The graph ends before the relatively recent growth of electric cars, which are just starting to have a major impact on our energy use.
As we know from last week’s blog, in order to calculate the carbon intensity of electricity, we need to know the composition of energy sources that our utility is using and the heat rate of each of these fuels. Table 1 quotes the EPA’s projected carbon intensity for NYC in the year 2024, when the punitive monitoring of our carbon footprints (in large buildings) begins. However, in truth, we have no idea what the carbon intensity of electricity production will be in 2024. For that, we’ll need regular data input from our electricity suppliers—either via a list of their energy sources and each fuel source’s heat content, so that we can calculate the carbon footprints ourselves—or as a statement included with our electricity bills that directly supplies an accurate account of their carbon footprints.
Here are NYC’s main utility companies:
NYC Electric Service:
Con Edison (All 5 boroughs, except for the Rockaways)
Most of New York City is powered by Con Edison, which provides power to nearly 10 million people in NYC and Westchester County. To serve its NYC customers, Con Edison has more than 94,000 miles of underground cable and 34,000 miles of overhead wires pumping electricity from substations to homes and offices. The power New Yorkers use comes from a variety of energy sources including sustainable sources such as wind and solar power. To easily start or transfer your services with Con Edison, click here.
Public Service Enterprise Group (Queens, Rockaway Peninsula only)
While Con Edison provides power to all 5 boroughs, it does not serve the Rockaway Peninsula in Queens. Roughly 34,000 customers in the Rockaways use power distributed by the Public Service Enterprise Group (PSEG), which also handles electricity distribution on behalf of the Long Island Power Authority. To start, stop, or transfer electric service on the Rockaway Peninsula, visit the PSEG site.
NYC Gas Service:
Con Edison (Manhattan, the Bronx, Northern Parts of Queens)
In addition to providing electric service to most of New York City, energy giant Con Edison also provides natural gas service to residents of Manhattan, the Bronx, and Northern Queens. If you live in these areas, you’ll have the convenience of using one provider for both your electric and gas service. Set up or transfer existing service using the same link provided above for Con Edison electricity.
National Grid (Brooklyn, Staten Island, Rest of Queens)
National Grid is a multinational electric and gas utility providing services to the UK and parts of the northeastern US. In New York City, National Grid provides gas service to Brooklyn, Staten Island, and most of Queens, including the Rockaways. To start or transfer your natural gas service with National Grid, please go here.
As we see above, Con Ed not the only electricity supplier in New York City but it is the most important one. Here’s what Con Ed says regarding their energy sources for electricity supply:
Con Edison is committed to advancing a clean energy future. We do not own coal fired power plants and 76% of Company-owned generation capacity was sourced from solar and wind in 2019.
Additionally, Con Edison supports New York’s ambitious goals to transition to a low-carbon, clean energy future, which include but are not limited to, 100% carbon-free power by 2040 and 70% renewable electricity by 2030. The fuel mix delivered through our energy systems is not controlled by the Company and is allocated by the New York Independent System Operator.
CECONY [Consolidated Edison Company of New York] Fuel Mix Allocated by NYISO
-
-
- Natural Gas 51.1%
- Nuclear 37.5%
- Hydro 7.4%
- Other 1.3%
- Oil 1.1%
- Wind 1%
- Coal 0.3%
- Solar 0.2%
-
Con Edison Owned Generating Capacity (Total 3,463 MW)
-
-
- Solar 64.1%
- Natural Gas 21.4%
- Wind 12%
- Petroleum 2.5%
-
Con Ed doesn’t decide on the percentages of various fuels in the CECONY mix. A different organization, NYISO, is in charge of those matters. That said, Con Ed does offer a choice between two different mixes, one more sustainable than the other (albeit, a bit more expensive).
When we calculate the carbon intensity of the CECONY feed, the only relevant aspect is the percentage of fossil fuels in the mix. Natural gas is responsible for 51% of the output, whereas oil and coal are minor additives that, in this case, we can neglect. I don’t have the individual heat content of Con Ed’s natural gas use, so I will take the 2019 average for the US: 8000 Btu/kWh.
This value gives us an energy conversion of:
(3412Btu/8000 Btu) *100 = 43% conversion efficiency
Bringing Con Ed’s electricity carbon efficiency to:
0.0531*0.51/0.43 = 0.063 kgCO2/kbtu
This comes out to be considerably lower than the corresponding value in Table 1 (0.0847 kgCO2/kbtu). The heat rate from natural gas is changing and NYC has more than one utility that supplies electricity, so it’s hard to determine where the number in the table came from.
For more transparency, utility companies should produce carbon intensity calculations on a yearly basis—or, at least, when they change the composition of the fuel or change the conditions of the energy conversion. Likewise, electricity meters should be modified to accept the changing values of the carbon intensities and a scale should be added for the carbon footprints.
thanks for sharing