My recent blogs have focused on COP27 and its main decision of creating a mechanism for developed countries to transfer resources to developing countries to help them adapt to the damage that climate change inflicts. The best way for everybody to minimize such damage is, obviously, to minimize climate change itself by minimizing the increase in atmospheric greenhouse gas concentrations. The best way to accomplish that objective is to minimize the use of fossil fuels through a transition to non-carbon sources. This topic has come up repeatedly throughout the more than 10 years I’ve been writing this blog. Just put the title of this blog in the search box and see what you get.
Russian attempts to weaponize Europe’s dependence on its energy supply to try to minimize military aid to Ukraine (February 8, 2022 blog), have suddenly made energy resilience one of the most important considerations. Partly as a result of these pressures, the world found itself accelerating the transition to sustainable energy sources.
Last week’s blog showed that globally we are fast approaching the conditions in which our use of sustainable energy sources will surpass our use of fossil fuels. In the European Union, this landmark has already been reached.
Last week’s blog focused on this transition. One can say that the Russian invasion of Ukraine helped to put energy resilience in phase with climate change mitigation. It highlighted the need to replace fossil fuels as quickly as possible with sustainable energy sources.
The identity that can quantify the transition is the IPAT identity. Put IPAT into the search box and you will get many entries. A relevant entry for the present topic is the January 24, 2017 blog, “Searching for Limits – Stability for a Distant Future.” The general form of the identity is shown in Equation 1:
Impact = Population x Affluence x Technology (1)
Population and affluence (expressed as GDP/Capita) are self-explanatory. The technology term for energy emission of carbon dioxide is shown in equation 2:
Technology = (Energy/GDP)x(Fossil/Energy)x(CO2/Fossil) (2)
With population and affluence growing, the way to reduce climate change impact is to reduce the technology term of the IPAT identity. The earlier blog summarized the challenge in the following way:
Almost all of the future scenarios for climate change make separate estimates of the indicators in this equation. The difference factor of 15 in GDP/Person (measure of affluence), between the average Chinese and average American makes it clear that the Chinese and the rest of the developing world will do everything they can to try to “even the score” with the developed world. The global challenge is how to do this while at the same time minimizing the environmental impact.
Last week’s blog emphasized the last two terms in equation (2), which deals with the nature of energy sources. It did not deal with the increase in energy efficiency which is expressed in the form of energy intensity: Energy/GDP. One reason for that is that the global energy intensity has been decreasing during the last 25 years, as is shown in Figure 1 and the summary paragraph in the Energy Information Administration (EIA) report shown below:
Worldwide energy intensity, measured as energy consumption per unit of gross domestic product (GDP), decreased by nearly one-third between 1990 and 2015. Energy intensity has decreased in nearly all regions of the world, with reductions in energy intensity occurring both in the more developed economies of the Organization for Economic Cooperation and Development (OECD) and in the emerging nations of the non-OECD.
Differences in energy intensity across countries and regions correspond to underlying factors such as economic structure, climate, and geography. Manufacturing-focused economies tend to use more energy per dollar of GDP than service-focused economies. Countries and regions with wider temperature variations tend to use more energy for heating and cooling. The distances between urban areas—and the infrastructure within them—can influence the amount of energy used to move goods and passengers.
Historically, energy intensity levels in non-OECD countries have been higher than levels in OECD countries. In many non-OECD countries, economies have been industrializing and rely on more energy-intensive forms of energy use. In contrast, many OECD countries have transitioned from relying on energy-intensive manufacturing to using more services-based economic activities that are less energy intensive. Based on 2015 estimates, OECD countries used on average 12% less energy per dollar of GDP than non-OECD countries.
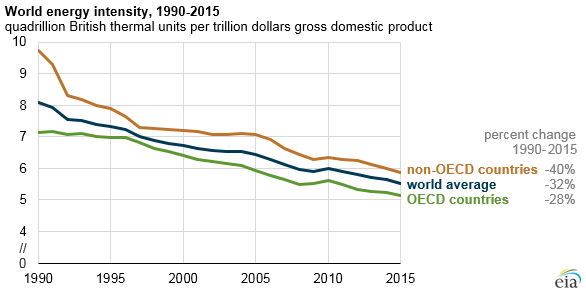
Figure 1 – Global Energy intensity (Source: EIA)
The decrease in energy intensity over this time span applies to the global average as well as OECD (Organization for Economic Cooperation and Development) countries. OECD countries roughly correspond to developed countries. The graph shows that the rate of decline of the energy intensity in the developing countries is a bit faster than that of the rich countries.
Figure 2, taken from the same EIA source as Figure 1, shows the value of the energy intensity in one selected year (2015) and it shows that the differences are not necessarily anchored on the wealth of the countries (China in the more energy-intensive group and Japan in the less energy-intensive group).
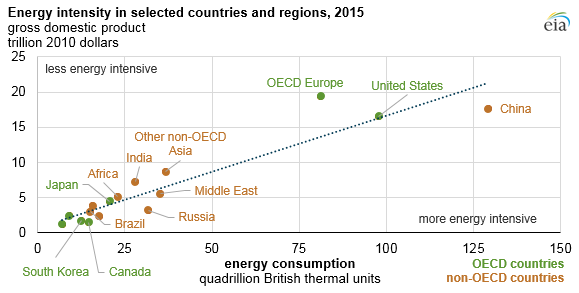
Figure 2 – Energy Intensity by region and country (Source: EIA)
Figure 3, also taken from the same EIA source, shows the changes in energy productivity (more productive is equivalent to smaller energy intensity) between 1990 and 2015. It also shows no obvious trend between the rich and the poor countries.
All these data show that the decrease in energy intensity is now a long-term trend, common for rich and poor countries. It shows that short-term changes such as COVID and the Russian invasion of Ukraine cannot be easily separated from long-term trends.
It is still not clear to me what drives the long-term decline in energy intensity. Popular explanations such as Environmental Kuznets Curves (see the May 14, 2019) in which one assigns the cause as the transition from an energy-intensive heavy industry development phase to a service-based phase do not agree with the data. Whatever the cause, the trend supports trends toward decreasing the energy impact on climate change. It’s another reason for our children to be thankful.
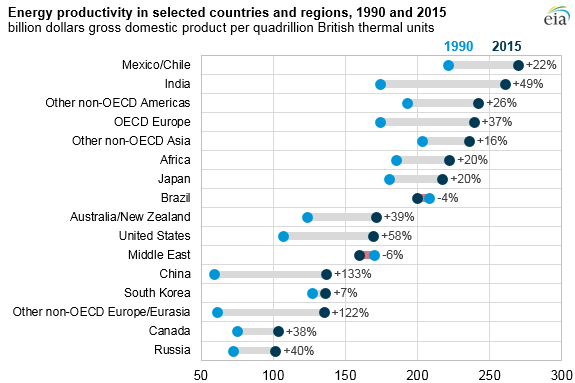
Figure 3 – Recent changes in energy intensity in selected regions and countries (Source: EIA)
The sudden impact of Russia’s invasion of Ukraine and Europe’s desire to untie itself from the weaponized Russian natural gas dependence can be seen in Figure 4, which measures a month’s change in the use of natural gas in the OECD countries. Europe is trying to liberate itself.
Stay tuned.
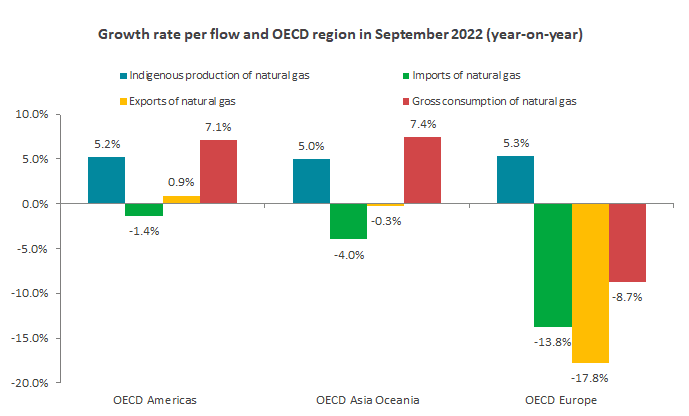
Figure 4 – Changes in the use of natural gas in OECD countries (Source: IEA monthly gas statistics)
Personally, I think a reason for the decrease in energy intensity is because of increasing awareness of how much harm we are causing. That, and due to advances in technology that allow less energy to be used while achieving the same efficiency.