Hello to everybody, we are the guest bloggers Amged Haimed, Junfeng Lu, and Haosheng Chen. We are all undergraduate students majoring in physics. Under the guidance of Micha Tomkiewicz, PhD, we have been able to use our backgrounds and experiences to better understand the relationships between carbon, GDP, and energy intensity, along with how to use energy more efficiently to produce improved economic effects from each energy unit.
Our topic here is carbon and energy intensities in the US, so first of all, we will give you some definitions and descriptions. Energy intensity is one of the most commonly used indicators for comparing energy efficiency in different countries and regions, given that it reflects the economic benefits of energy use. The two most frequently used methods for calculating energy intensity are the energy consumed per unit of gross domestic product (GDP) and the energy consumed per unit of output value. The output value used by the latter is highly unstable due to changes in market prices. Therefore, unless otherwise specified, we are using energy intensity to refer to energy consumption per unit of GDP.
Of course, since we are limiting our study to the US, we can skip the next step, which would otherwise be assessing the PPP. In international comparisons, GDP is often converted according to purchasing power parity (PPP) and the calculation results can differ from those found using the market exchange rate method. Although we are not using it now, PPP can be a very clear way to show the relationship between a country’s economy and energy.
Nowadays, there is a common refrain that in order to save our world, we need to use more renewable energy sources that either produce less carbon than traditional fossil fuels or no carbon at all. These alternatives include solar, wind, hydroelectric, and nuclear energy. We already know that burning coal, gas, wood, and even natural gas will release carbon dioxide.
Carbon intensity refers to the amount of carbon dioxide emitted per unit of GDP. The level of carbon intensity does not indicate the level of efficiency. In general, carbon intensity indicators decline as technology advances and the economy grows. The intensity of carbon emissions depends on the carbon emission coefficient of fossil energy, the structure of fossil energy, and the proportion of fossil energy in total energy consumption.
Data Collection
Carbon dioxide represents air pollution and the greenhouse effect; at the same time, it also reflects the energy consumption levels of a country or region. Presently, fossil fuels that produce large amounts of carbon dioxide are our main source of energy. Therefore, the more energy we use, the more carbon dioxide we produce. The energy generated is consumed and used for economic development in the states. The economic situation for each state will be presented in GDP. GDP reflects the contributions of both carbon emissions and energy consumption as they relate to the region. The greater the demand for carbon and energy in a state, the higher its GDP will be raised; the consumption of energy is proportional to the GDP.
However, this does not mean that the state that releases the most carbon in its energy production and energy use will necessarily have the highest GDP. While the use of energy can help increase GDP, it is not the only factor. A state’s economy will be affected by many elements, such as cross-regional trade.
Energy intensity is based on energy consumption and GDP, which represents the efficiency of energy use; it is the ratio of energy consumption to GDP of each state. Energy consumption and GDP are both variables in energy intensity; any change in either one can affect the net result. In this case, however, we are focusing on energy consumption as the primary influencing factor.
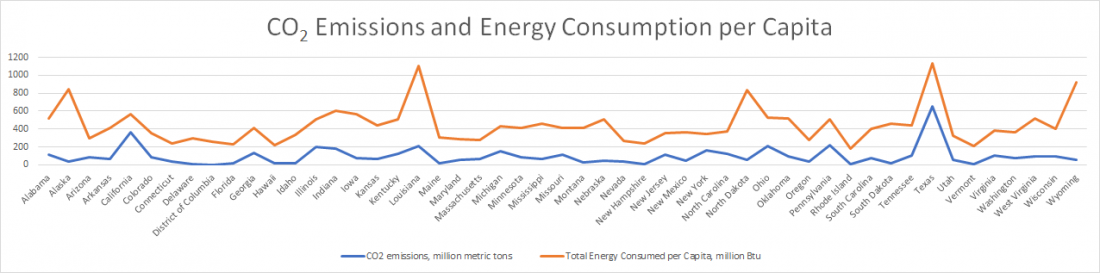
Figure 1 – State carbon dioxide emissions and energy consumption per capita in each state, 2016
From Figure 1, higher carbon emissions in states correspond to higher energy consumption.
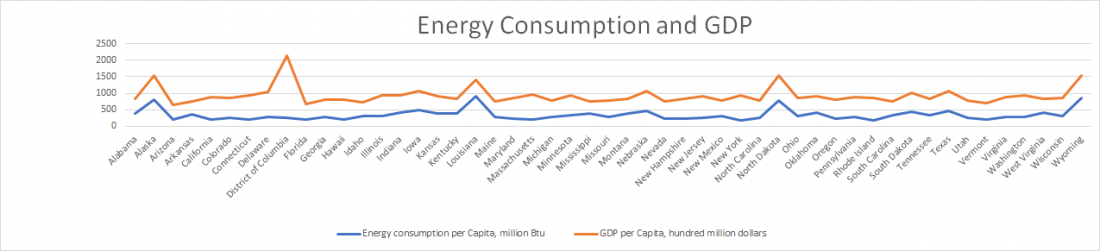
Figure 2 – GDP and total energy consumption per capita in each state, 2016
In Figure 2, some states’ GDPs will change along with their energy consumption. Other states have stable GDPs and are not subject to such changes.
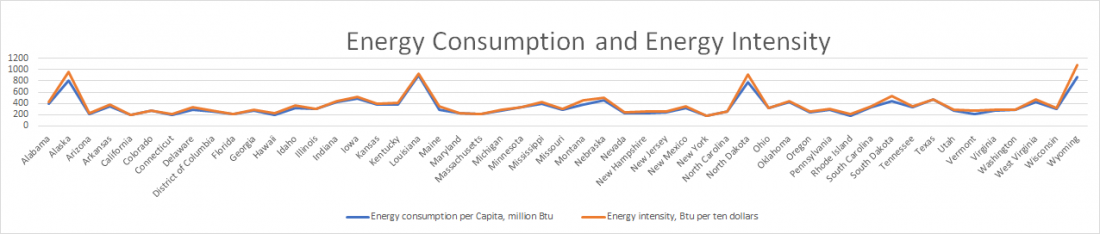
Figure 3 – Energy intensity and energy consumption estimates per capita in each state, 2016
Figure 3 shows the aforementioned states’ changes in energy consumption and how that has affected their energy intensity.
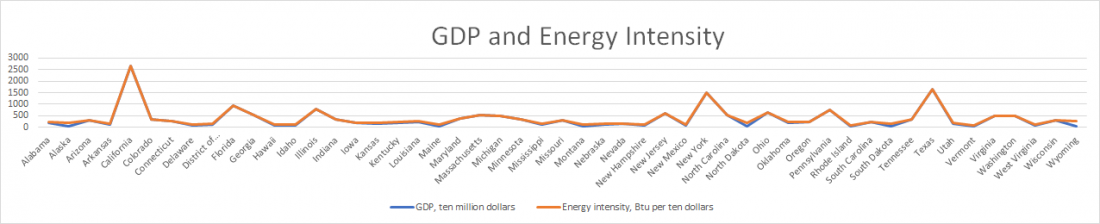
Figure 4 – Energy intensity and GDP in each state, 2016
In Figure 4, fluctuations in energy intensity in most states follow changes in state GDP.
Texas
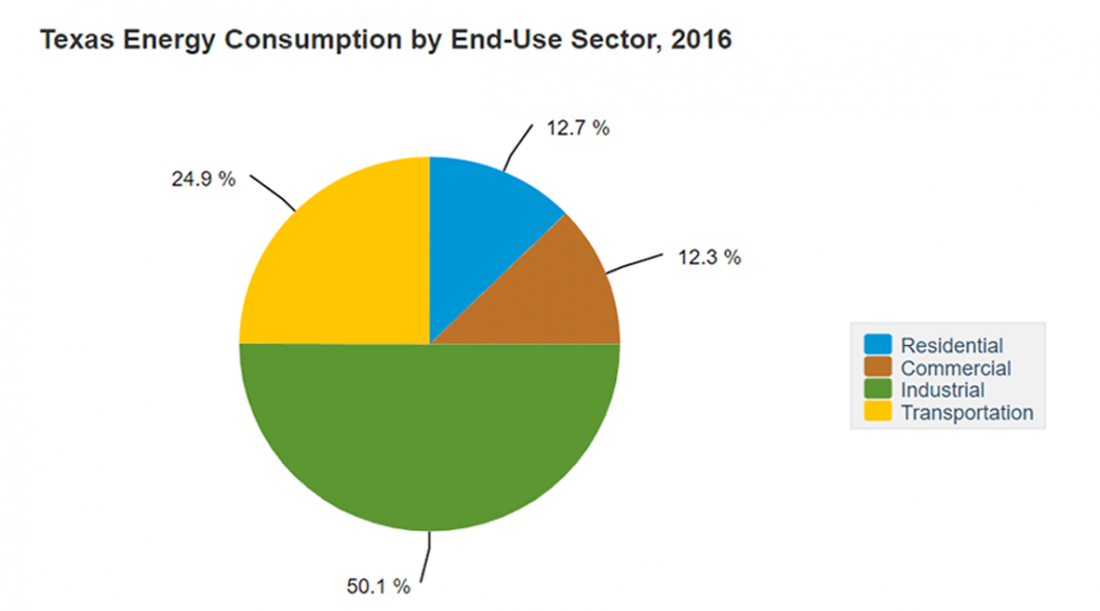
Figure 5 – Breakup of Texas’ energy consumption
Texas consumes more than half of its energy in industrial production. Indeed, Texas produces most of the country’s technical industrial products. Most notably, the majority of students in the US use graphing calculators from the state. These products from Texas are sold around the world. The lucrative profit from this sector has become the most important component of Texas’ GDP.
California
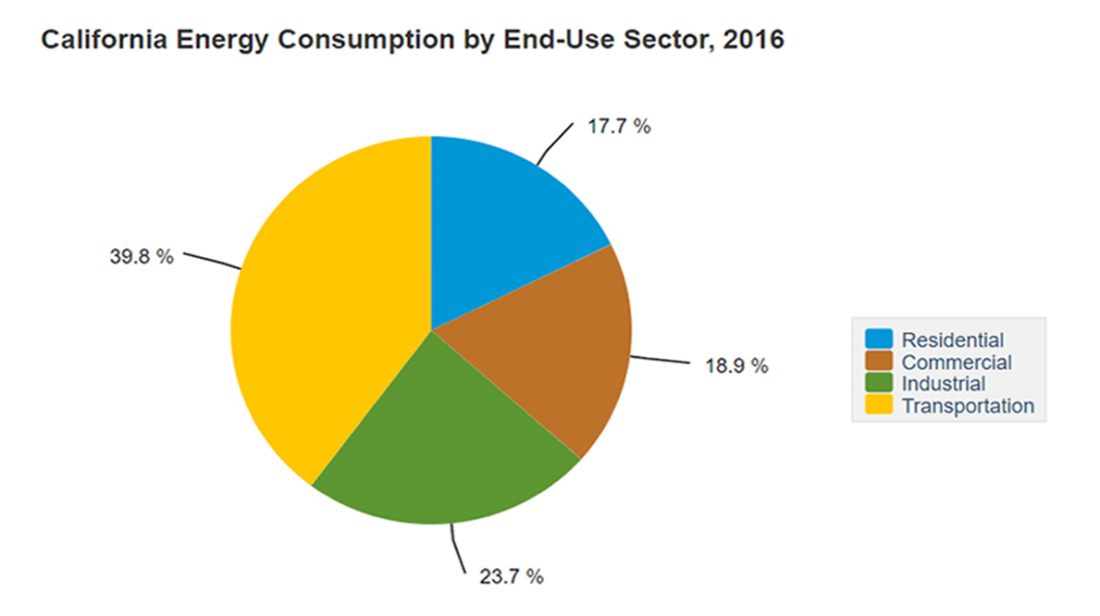
Figure 6 – Breakup of California’s energy consumption
Figure 6 clearly shows that transportation accounts for about 40% of California’s energy consumption. As the largest transportation hub in the western United States, a sizeable number of sea freighters and planes land in California every day. Many internationally traded goods—both incoming and outgoing—ship through the state’s transportation centers. Unlike Texas, which is a purely industrial production state, California has an immense number of commercial operations. Because its economy is primarily based on massive cargo operations, California’s carbon and energy use is proportional to its GDP.
New York
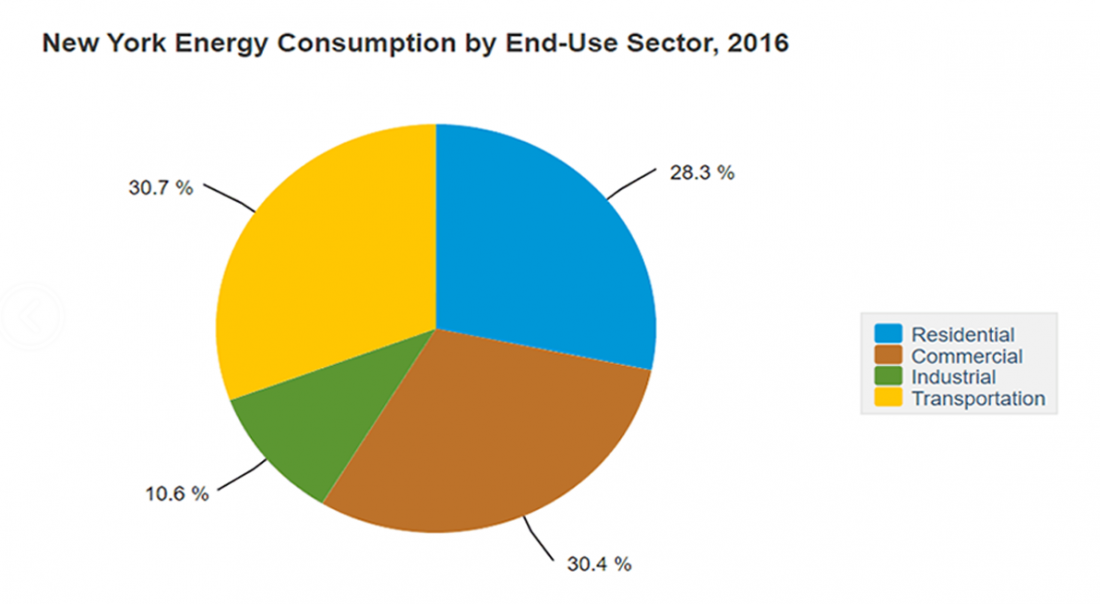
Figure 7 – Breakup of New York’s energy consumption
In Figure 7, New York is a high energy intensity state. It balances this usage between housing, business, and transportation, but uses relatively little in industrial production. The ubiquitous advertising screens and neon lights on Broadway consume huge amounts of energy both day and night. In addition, due to the dense population of New York, a large number of household appliances, along with air conditioning and winter heating also consume a lot of energy. The high population also drives the development of an ever-larger transportation system, whose convenience facilitates people’s lives. All of these elements work together, pushing up the state’s energy intensity because it also boosts New York’s GDP.
Conclusions
Our analysis, along with the various graphs, shows how different states’ carbon use impacts their energy intensity. When more carbon is used, the energy consumption will be higher, because the energy produced will be consumed. The consumed energy will also drive the growth of a state’s GDP, but that does not necessarily mean that high GDP is equal to high energy consumption. Energy intensity refers to the comprehensive efficient utilization of regional energy: that is, the ratio of regional energy consumption to GDP. Higher energy intensity in states represents high energy efficiency and high economic efficiency. In other words, the use of carbon will directly or indirectly affect changes in the state’s energy intensity.
References
- Energy intensity. (n.d.). In University of Calgary Energy Education Encyclopedia. Retrieved from https://energyeducation.ca/encyclopedia/Energy_intensity
- Deviren, Seyma Akkaya & Deviren, Bayram. (Available online 8 February 2016). The relationship between carbon dioxide emission and economic growth: Hierarchical structure methods. Physica A: Statistical Mechanics and its Applications, volume 451 Retrieved from https://www.sciencedirect.com/science/article/pii/S0378437116001497
- Table C13. Energy Consumption Estimates per Capita by End-Use Sector, Ranked by State, 2016. Independent Statistics and Analysis. (n.d.). Energy Information Administration (EIA). Retrieved from https://www.eia.gov/state/seds/data.php?incfile=/state/seds/sep_sum/html/rank_use_capita.html
- Energy-Related Carbon Dioxide Emissions by State, 2005-2016. Independent Statistics and Analysis. (n.d.) Energy Information Administration (EIA). Retrieved from https://www.eia.gov/environment/emissions/state/analysis
- Independent Statistics and Analysis. (n.d.). Energy Information Administration (EIA) Retrieved from https://www.eia.gov/state/
Wish you the best.
I have an article on “Energy, Carbon Intensity of Economy, and Climate ready looking for publication in a reputed journal. In brief , US industries are loosing quadrillions BTU energy, emitting billions tons of carbon dioxide, consuming gigatons of resources, costing trillions of dollars. Energy efficiency improvements can minimize these losses and help industries and economy to grow with substantial reductions in emissions. become green and sustainable and limiting climate change. The
I have written a unique combination of four books on these and related subjects.
Looking forward in publishing this article in US journal
Hundreds of millions of years material has been getting squished and cooked by lots of pressure and heat
I find it interesting that such a large portion of New York’s energy is consumed by transportation. Do you have any suggestions for we can reduce this this high consumption?
From your post, I wanted to know how high energy intensity indicates high energy efficiency? I understand that GDP is a measure of variables such as consumerism, investments, government spending, and trade. Therefore higher carbon emissions would indicate a higher GDP. However, there is concern that GDP is not completely reflective of issues such as economic equality. Because of this, a person with greater wealth can afford more energy expenditure, and needlessly drive up energy and carbon emissions, as opposed to someone who has to be more conservative with energy usage. Is it possible that higher energy intensity may actually indicate lower energy efficiency?
Thank you for the informative post! I just had a few questions regarding some of the content covered. Firstly, for a state like Texas where 50 % of the energy consumed is for industrial production, how do you suggest they should shift the production of the energy for use in this industrial sector. If they were to make a change to renewable energy production do you believe that it would have a large affect on the states GDP. Especially since the shift toward renewable sources would likely cost the industrial sector millions of dollars, what way could these costs be mitigated? And would the resulting increase in carbon efficiency be worth the possible plunge in GDP? Continually, do you believe that a state like New York, where a large proportion of the energy is consumed by transportation, would have an easier shift to more efficient energy and electricity usage because the transportation sector has more direct government control than the industrial sector?
From your blog post, I noticed you explained energy intensity as an effect of carbon emission. Could this question be addressed the other way around? I thought that carbon dioxide is emitted due to the burning of fossil fuels. Therefore, the main question could be ‘how energy intensity affects carbon emissions in the US?’
Also, I like how you explain energy consumption as a factor contributing to a state’s GDP. I believe a large factor in this is electricity because states use their electricity produced to aid in economic growth. I believe that a good start in reducing carbon emissions would be to start producing our electricity from cleaner sources.
I noticed that you guys mentioned biomass as a non-renewable source of energy. Though it is true that it does produce carbon while being burned it is still considered a renewable source because its net carbon production is 0. Also for figure 3 I noticed that energy consumption and energy intensity are almost the exact same. I don’t understand how this is possible if intensity is consumption divided by GDP, did you use different scales on the y axis? Also, can you please specify if there is any direct relationship between CO2 and energy intensity since there is no graph comparing the two.
While the analysis does show the variation of energy intensity in different states, I’m a bit confused as to how it was assumed that a correlation exists between GDP and energy intensity. Is there any data that you can find to prove this correlation? In addition, I noticed that a time series graph style was used to show the GDP and energy consumption per state. Wouldn’t a different style be more appropriate considering this data is cross-section? Perhaps a bar graph? While these could be seen as minor nuisances, it can skew the intended use and interpretation of the data.