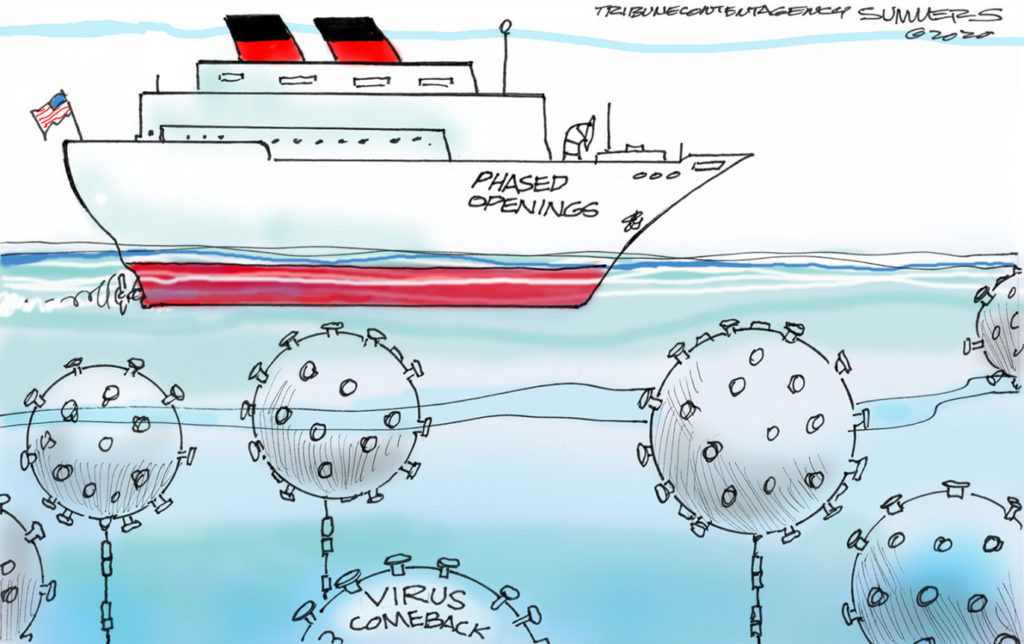
Figure 1 – Dana Summers’ cartoon on phased opening
Roughly two months ago, my campus completely shifted to remote learning and teaching and I started lockdown. I have made a corresponding shift here, covering the COVID-19 viral pandemic that now dominates our life. Epidemiology and virology are not my fields and aside from my general science background I don’t have any more to contribute here than most of my readers. As a result, I have tried to focus my discussions on comparing COVID-19 with climate change. Both are global phenomena that have disastrous consequences for humankind but they have very different time scales.
Since talk of the pandemic has now shifted to the safety of opening the world economies based on various countries’ rates of infection, death or stability, I feel that I need to make the interconnection between COVID-19 and climate change more solid. To do that, I will resort to a much more basic aspect of both climate change and COVID-19: their contagiousness.
The dictionary defines contagiousness as, “capable of being transmitted by bodily contact with an infected person or object” (Dictionary.com). There is no question that COVID-19 is highly contagious. I described its mechanism of contagion in some detail in a previous blog (April 14, 2020). It is essentially a chain reaction in which the virus replicates in its hosts and given the opportunity, moves to other possible hosts to spread its impacts. The quantitative parameter that I described in that blog was the R0 (R naught) number: “the average number of individuals that are impacted in a given situation.” In that blog, I included the R0 number for a few previous viral pandemics. Any virus with an R0 number greater than 1 is considered contagious. COVID-19 (SARS-CoV-2) has one of 1.5-3.5.
Germany is the only country that I am aware of that uses the R0 number as its criterion for the controlled reopening of its economy. The R0 number in Germany rests around 1. Some days it’s a bit higher and some days it is lower.
“[A]s long as it remains around 1.0, that is considered a stagnation and not an increase.” … A reproduction factor of 1.0 means that, on average, one infected person is spreading the virus to another person.
This article explains some of the reasons for these fluctuations. However, to calculate an R0 number you need a solid estimate of the spread of an infection. Our best estimate is that in the US, only about 3% of the population has been tested. We cannot calculate the extent of infection or an R0 number based on such a low availability of testing.
Viral pandemics are not the only processes that proceed through chain reactions.
The most positive example of this type of growth—and the one that is probably the most familiar—is money that is deposited in the bank with a constant interest rate. The bank pays interest on the growing money. So, if I start with $100 at 10% interest per year, I will have $110 at the end of the first year, $121 at the end of the second year, etc. I will double my money in 7 years. The formula for this growth is:
Doubling time = 70/P(%)
Where P is the interest rate. This kind of growth is known as exponential growth, and I have discussed it throughout this blog in varying degrees of detail. Populations grow in a similar way.
Perhaps the most famous growth that follows the same mechanism is that of nuclear fission, which gives rise to the energy released in nuclear reactions (for a power plant) or nuclear explosions (in atom bombs).
This is probably the most visible analogue to the viral spread. Figure 2 shows how it works with a fission of uranium. A single neutron (one of the basic components of the nucleus of an atom) hits a uranium nucleus and the collision splits the nucleus into approximately two smaller nuclei. In the process, the collision releases a few more neutrons and a great deal of energy. In the case of uranium, the collision releases 2-3 neutrons which, if they can, will hit other nuclei and repeat the process. This will continue as long as the neutrons can find other uranium nuclei to collide with.
![]()
Figure 2 – Nuclear chain reaction
The viruses in a pandemic are the equivalent of the neutrons and the R0 number corresponds to the average number of the “productive” neutrons that actually split the next nuclei. To be able to sustain the chain reaction, the R0 number has to be greater than 1. If it is smaller, the chain reaction is quickly extinguished. If each nuclear collision releases between 2-3 neutrons, how can the equivalent “productive” collision have a value smaller than 1?
- The geometry of the material is such that many of the neutrons escape and thus are unable to hit other nuclei. Since the target nuclei are not absorbing all of the collisions, some of the neutrons are wasted in propagating the chain reaction. The easiest way to control the average number of neutrons that actually participate in the process is to adjust the geometry of the sample with a big enough mass to minimize the number of escaped neutrons. This configuration with this mass is called a critical mass, below which a nuclear explosion will not take place (December 18, 2018 blog).
- The second way to adjust the equivalent of “productive” neutrons is to adjust for their velocity by moving the neutrons through a medium such as graphite that can slow them down. This technique is mainly used in nuclear reactors.
In terms of the virus, the easiest way to minimize the transmission and reduce the R0 is to maintain social distancing through lockdowns, use protective gear that will block transmission, and/or find a vaccine to combat the virus.
What does all of this have to do with climate change?
To answer this question, I have to go back to a graph which I have used in multiple previous blogs. The last time that I used Figure 3 was on April 28, 2020, when I compared the uncertainty in predicting the impact of climate change and COVID-19. This figure is especially helpful when discussing the role of feedback in climate change.
Within a chain reaction, any propagation accelerates through positive feedback. This means that the products of the reaction accelerate its further progress. As I mentioned in the July 10, 2018 blog, Figure 3 illustrates the impact of the most important greenhouse gas (carbon dioxide) on the rising global temperature. However, only about one third of the impact comes directly from the physical properties of the greenhouse gas. The other two thirds of the impact originate from feedbacks such as: the rising temperature of the ocean, which enhances evaporation and increases atmospheric concentrations of water vapor; the heated atmosphere’s ability to hold increased amounts of water vapor. Another feedback mechanism involves the melting of snow caps, which decreases reflection of solar radiation (decreased albedo). In Figure 3, the main accelerating element is heat.

Figure 3 – Carbon intensity (July 10, 2018 blog)
This is because two thirds of the driving forces behind the temperature rise do not come from direct exposure to greenhouse gases such as carbon dioxide but rather feedback to the direct heating. The feedback comes from physical heat-dependent driving forces such as changes in the atmospheric water vapor, clouds, snow melt, permafrost melt, changes in solubility of carbon dioxide in the ocean, etc. The J. Hansen et. al. manuscript, “Climate Sensitivity: Analysis of Feedback Mechanisms” (1984), is an excellent early paper on many of these feedback mechanisms.
Wild fires, such as those that took place in California and Australia, represent another important climate change feedback mechanism: a chemical one. Wood burns at a high temperature and heat increases its flammability, so local ignition raises the temperature in the close vicinity and thus spreads the burning area.
I teach climate change at various levels in my school. One of the research projects that I am doing with some of my students is following and quantifying our school’s conversion into a more sustainable energy user. Such conversion is now mandated by both state and city laws. The COVID-19 lockdowns are an opportunity to differentiate aspects of Brooklyn College’s energy use and greenhouse gas emissions. Some of the energy serves the students directly; some powers the school’s infrastructure. This information is crucial to optimizing campus energy use on both budgetary and sustainability levels.