During my pre-retirement life, I was focused on teaching and doing research into how to improve the odds of a global shift to sustainable energy from reliance on fossil fuels. The objective in many of these activities was to lower the price of sustainable energy compared to fossil fuels and broaden its distribution. Well, this is happening now, mainly because of the investments that China is making in sustainable energy and its export of technologies that help other countries to harvest their own energy economically.
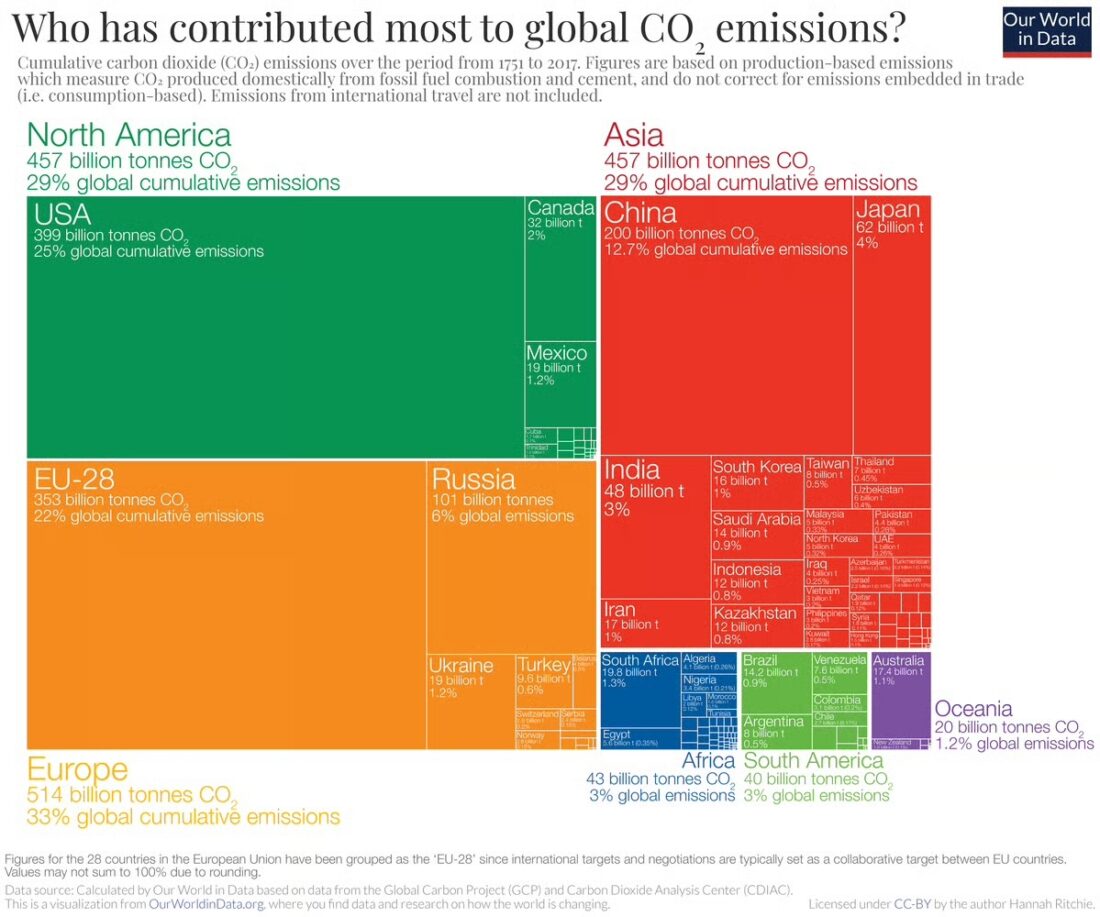
Figure 1 – Cumulative CO2 contributions from 1751-2017 (Source: Our World in Data)
As Figure 1 shows, the United States has been the clear leader in cumulative carbon dioxide contributions to the global atmosphere (1751-2017). Europe comes second, and China comes third, with roughly half of the US emissions. US GDP/capita in 2024 was $75,490, while China’s amounted to $23,850. Carbon dioxide has stayed in the atmosphere for hundreds of years. Climate change, triggered by carbon dioxide and other greenhouse gases, is not “respecting” national boundaries. Adaptations to climate change take place on a local level. However, to take part in carbon emissions mitigation, developing countries need help. Participation in the energy transition to sustainable energy—and actively adapting to anthropogenic climate change—both take money.
China is now classified by the World Bank as an upper-middle income country and a newly industrialized nation. It started out after WWII as a developing country. Figures 2 and 3 show that China is now far ahead of the US in both sustainable energy investment and its export.
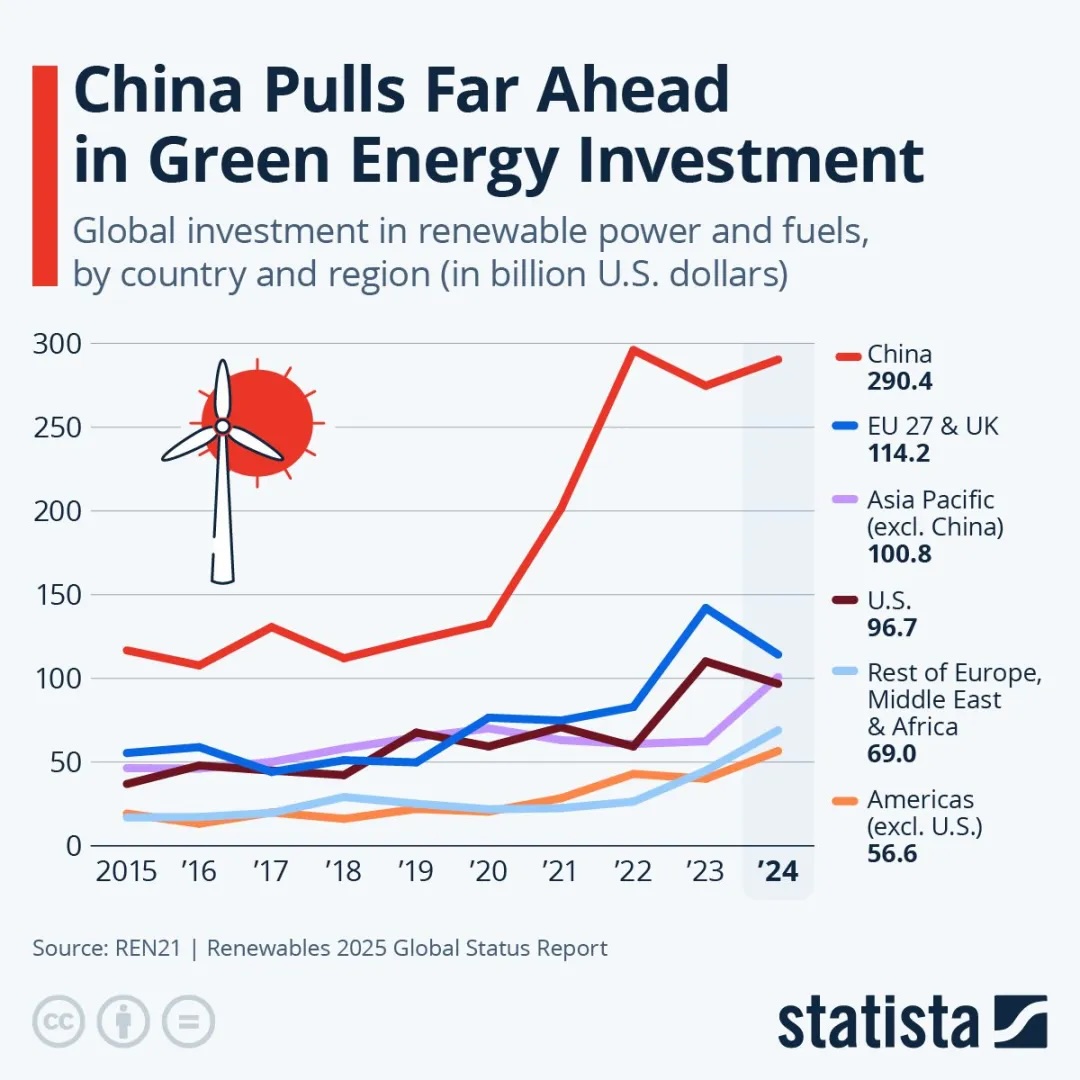
Figure 2 – Investment in renewable energy, 2015-2024 (Source: Statista)
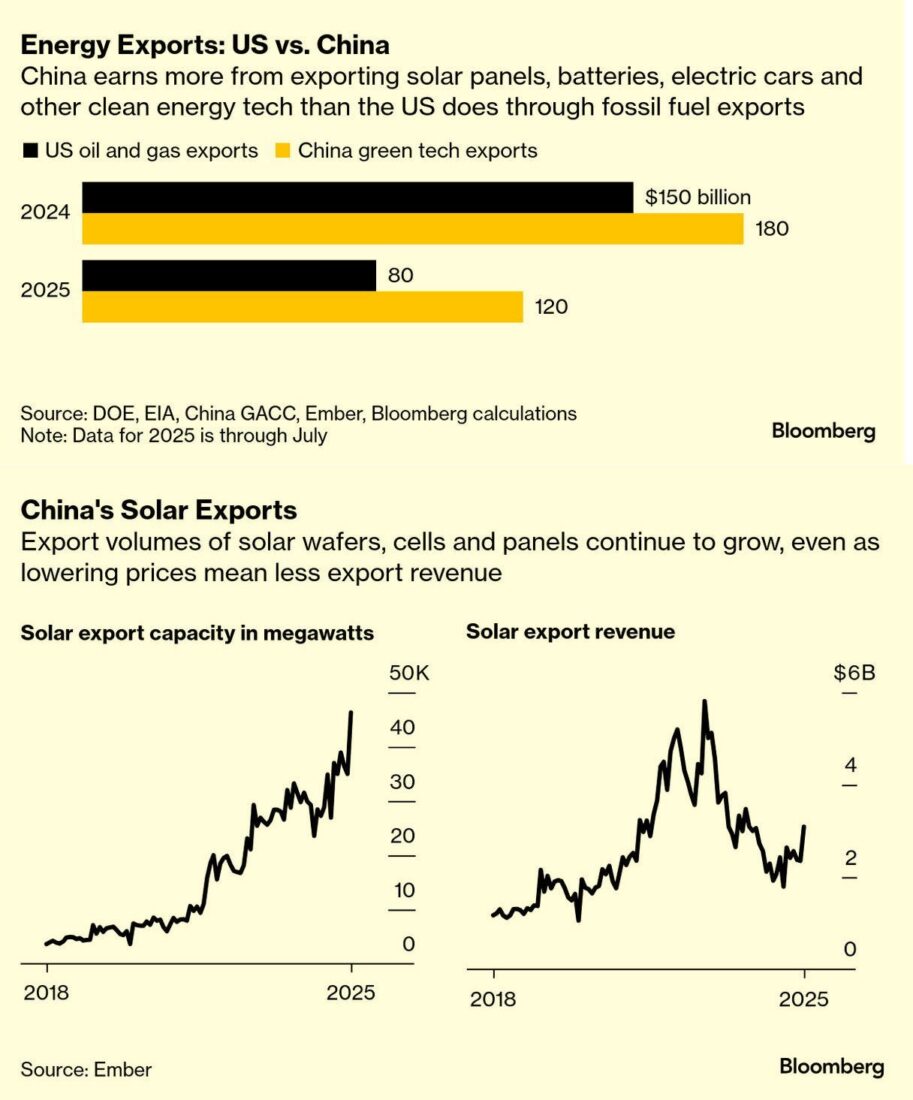
Figure 3 – US vs China energy exports, 2018-2025 (Source Medium)
Last week’s blog showed that China is overproducing sustainable energy beyond its ability to market it economically either internally or externally. Prices are also going down beyond the producers’ ability to sustain the supply. China is not alone:
Owing to the rapid spread of solar power, Spanish energy is increasingly cheap. Between 11am and 7pm, the sunniest hours in a sunny country, prices often loiter near zero on wholesale markets (see chart). Even in Germany, which by no reasonable definition is a sunny country, but which has plenty of wind, wholesale prices were negative in 301 of the 8,760 tradable hours last year.
As solar panels and wind farms take over Europe, the question facing the continent’s policymakers is what to do with all the power they produce. Ultra-low—and indeed negative—prices suggest that it is not being put to good use at present, reflecting failures in both infrastructure and regulation. There are three main ways that firms and regulators could establish a more efficient market: sending energy to areas where there is no surplus, shifting demand to hours when energy is plentiful, and storing energy as electricity, fuel or heat.
Not surprisingly, oil producers, including the US, are trying to fight back:
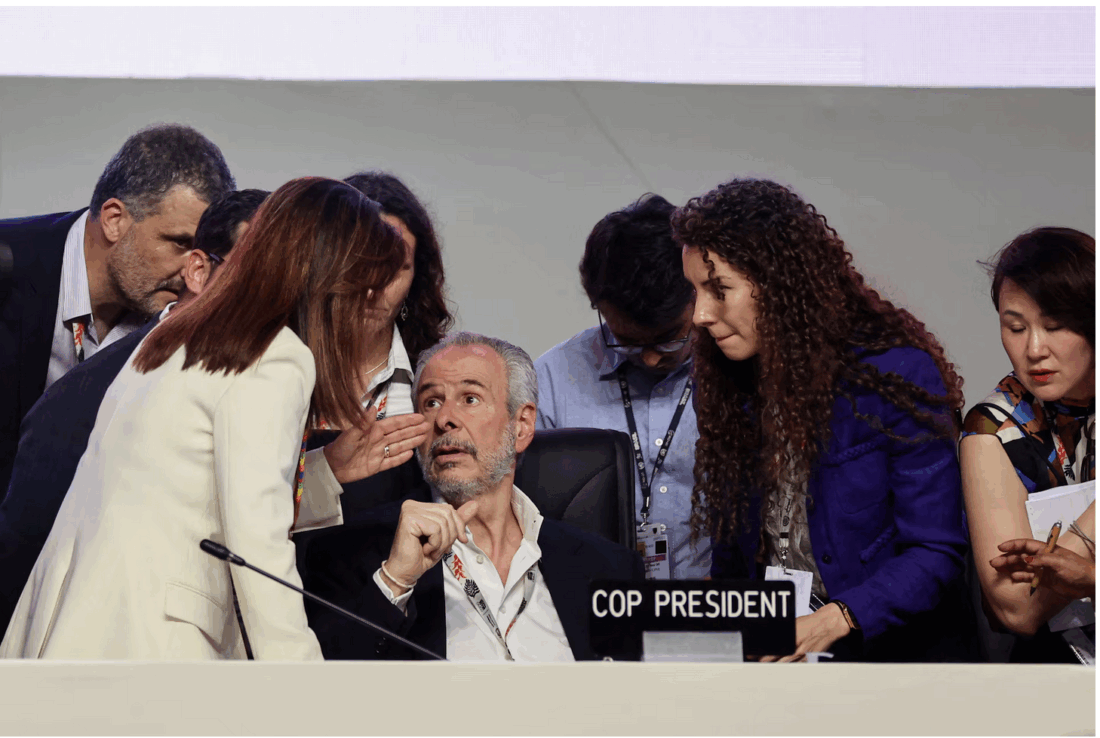
Brazilian diplomat and COP30 President André Aranha Corrêa do Lago has committed to lead an effort in 2026 to create two road maps: one on halting and reversing deforestation and another on transitioning away from fossil fuels in energy systems in a just, orderly and equitable manner.
What those road maps will look like is still unclear. They are likely to be centered on a process for countries to discuss and debate how to reverse deforestation and phase out fossil fuels.
Over the coming months, Corrêa plans to convene high-level meetings among global leaders, including fossil fuel producers and consumers, international organizations, industries, workers, scholars and advocacy groups.
For the road map to both be accepted and be useful, the process will need to address the global market issues of supply and demand, as well as equity. For example, in some fossil fuel-producing countries, oil, gas or coal revenues are the main source of income. What can the road ahead look like for those countries that will need to diversify their economies?
Developing countries are the most sensitive to the price tension between sustainable energy and fossil fuels. I wrote about this in an earlier blog (April 29, 2014) and took part in a short movie documenting the issue in India’s Sundarbans: Quest for Energy (Short 2012). I will return to this issue in two weeks as part of this series on changing global leadership.
I couldn’t find appropriate graphs to illuminate the conflicts, so I went to AI (through Google) to give me some help with two questions:
Q1 – Compare US and China contributions to transition developing countries to use sustainable energies:
China dominates through massive physical infrastructure projects and supply chain control, the U.S. focuses on high-standard institutional finance and “values-driven” partnerships.
Financial Contributions and Mechanisms
- China’s Bilateral Lead:China’s bilateral and regional climate-related assistance has surpassed that of the U.S., providing approximately $3 billion annually in climate-friendly finance compared to the U.S.’s $1.5 billion.
- S. Multilateral Strength:The U.S. remains the larger contributor when accounting for its stake in Multilateral Development Banks (MDBs). U.S. multilateral contributions average $5.9 billion per year, while China’s are roughly $0.9 billion.
- Concessionality:A critical distinction remains the quality of finance. U.S. and other OECD contributions are typically 75% concessional (grants or low-interest loans). In contrast, only an estimated 22% of China’s climate finance is grant-equivalent, with the rest provided as non-concessional debt.
- Strategic Infrastructure Initiatives
-
China’s Green BRI:In 2025, energy projects under the Belt and Road Initiative (BRI) reached a record $94 billion, with renewable energy (solar, wind, waste-to-energy) accounting for $18.3 billion. However, 2025 also saw a surge in fossil fuel engagement, with oil and gas projects totaling $71.5 billion—the “dirtiest” and “greenest” year in the BRI’s history.
-
S. Partnership for Global Infrastructure and Investment (PGI):The U.S. leads this G7 initiative aiming to mobilize $600 billion by 2027 for high-standard infrastructure. Key projects in 2025-2026 include the Lobito Atlantic Railway Corridor in Africa, supporting clean energy access and critical mineral supply chains.
-
Energy Generation Capacity:In 2025, Chinese BRI engagement added at least 2 GW of generation capacity to developing nations, including 14.6 GW of solar and 7.6 GW of wind.
-
Technology and Supply Chain Dominance
-
Solar and Wind Manufacturing:China produces roughly 80% of the world’s solar components and has led the world in wind power capacity for 15 consecutive years. This allows Chinese firms to offer renewable technologies at lower costs to developing markets.
-
Critical Minerals:China refines 19 out of 20 strategic minerals essential for the energy transition, maintaining a 70% average market share. The U.S. is responding by financing mining and processing facilities in countries like Brazil and Tanzania through the International Development Finance Corporation (DFC) to build alternative supply chains.
- Summary Comparison
| Feature | China’s Contribution (as of 2026) | U.S. Contribution (as of 2026) |
| Primary Vehicle | Belt and Road Initiative (BRI) | Partnership for Global Infrastructure (PGI) |
| Financial focus | Bilateral loans, non-concessional | Multilateral (MDBs), concessional grants |
| Energy Projects | Massive solar/wind/hydro + fossil fuels | Nuclear, clean energy supply chains, minerals |
| Strategic Edge | Low-cost tech and hardware exports | Transparency and high environmental standards |
Q2: What are the second Trump’s administration efforts on these issues?
In 2026, the second Trump administration has significantly altered the U.S. approach to the global energy transition, shifting from climate-focused aid to a policy of “energy dominance” centered on fossil fuels and nuclear power.
- Withdrawal from International Climate Frameworks
The administration has aggressively decoupled the U.S. from the global climate architecture:
- Shift in Energy Assistance Priorities
Foreign energy aid has been reoriented away from renewables toward traditional and emerging domestic technologies:
- Domestic Rollbacks Affecting Global Standing
The administration’s “One Big Beautiful Bill Act” (2025) has neutralized many international climate commitments by:
- Impact on the U.S.-China Rivalry
These moves have created a “leadership vacuum” that China has actively filled:
The change in global leadership in financing now extends beyond energy. One of the best indicators is the decline in US$ as an exchange currency for global trade.
THE DOLLAR is meant to be a source of safety. Lately, however, it has been a cause of fear. Since its peak in mid-January the greenback has fallen by over 9% against a basket of major currencies. Two-fifths of that fall has happened since April 1st, even as the yield on ten-year Treasuries has crept up by 0.2 percentage points. That mix of rising yields and a falling currency is a warning sign: if investors are fleeing even though returns are up, it must be because they think America has become more risky. Rumours are rife that big foreign asset managers are dumping greenbacks.
I will return to this issue in future blogs.
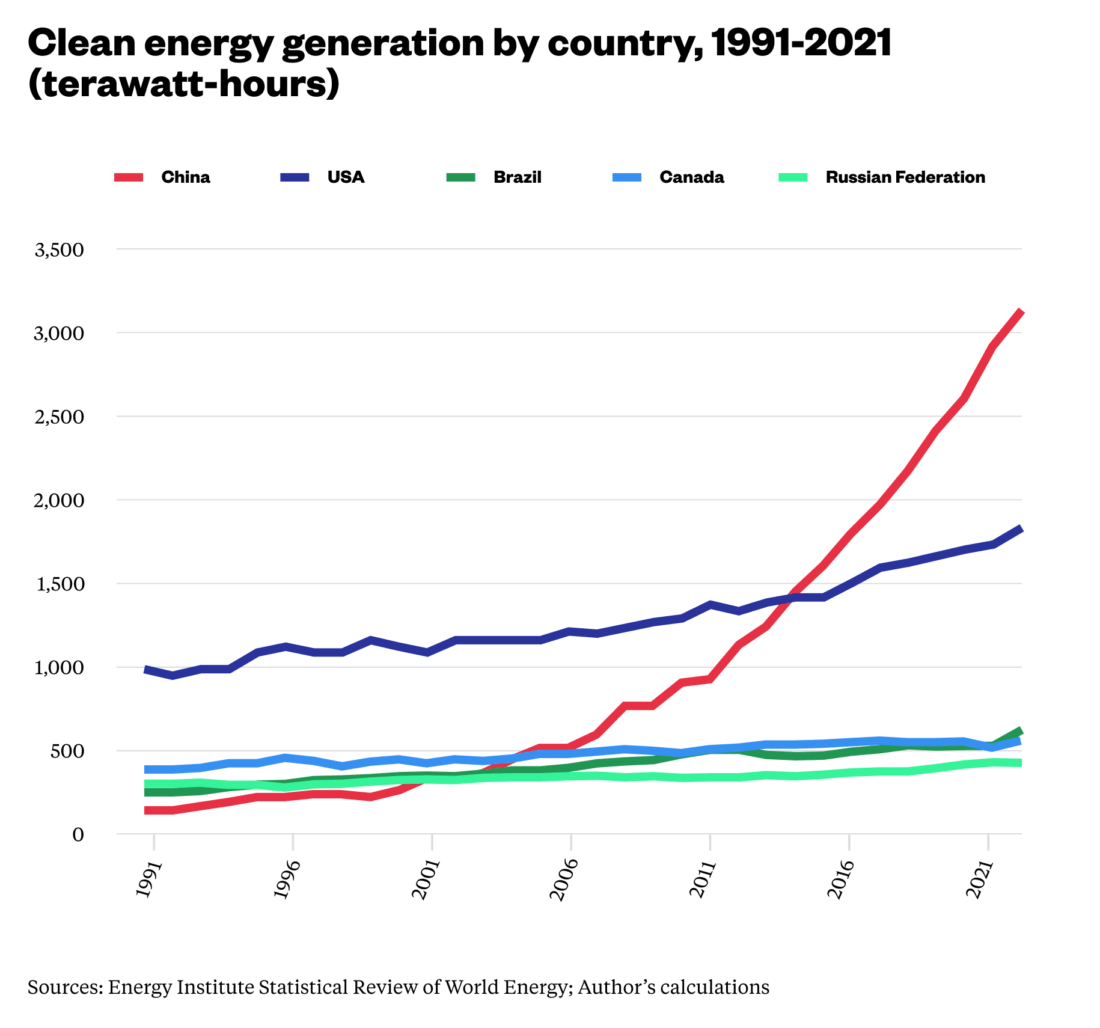 Figure 1-
 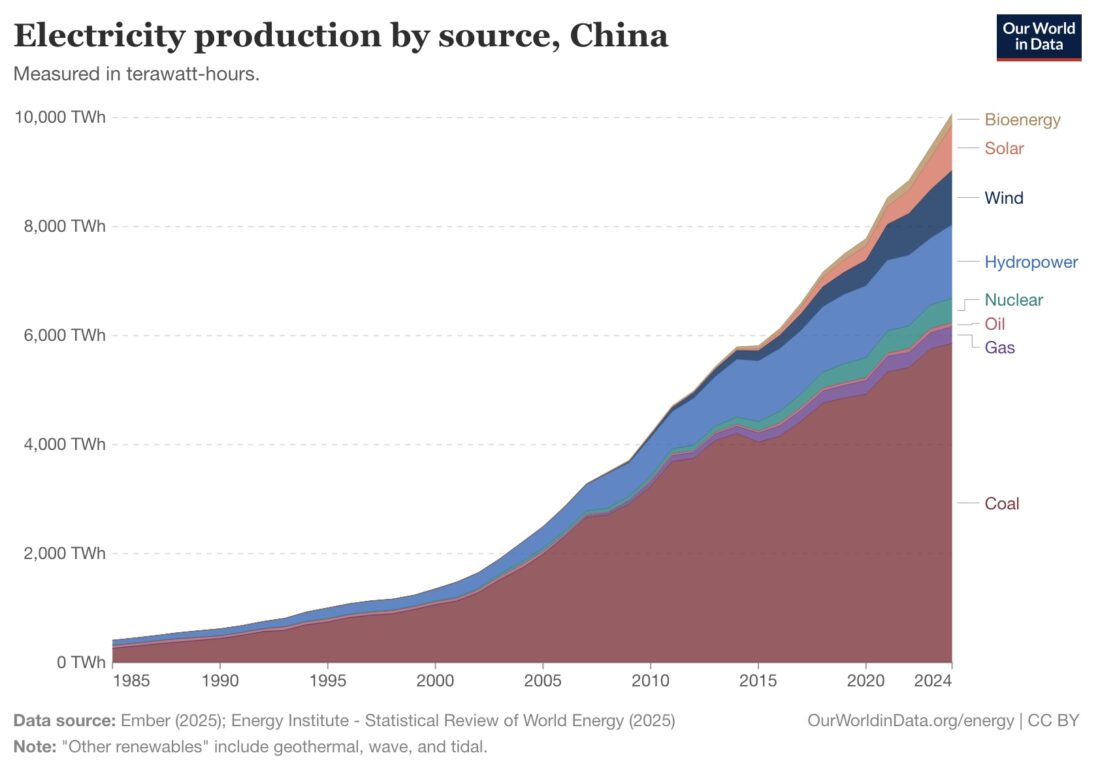 Figure 2 – Graph of China’s electricity production by source, 1985-2024
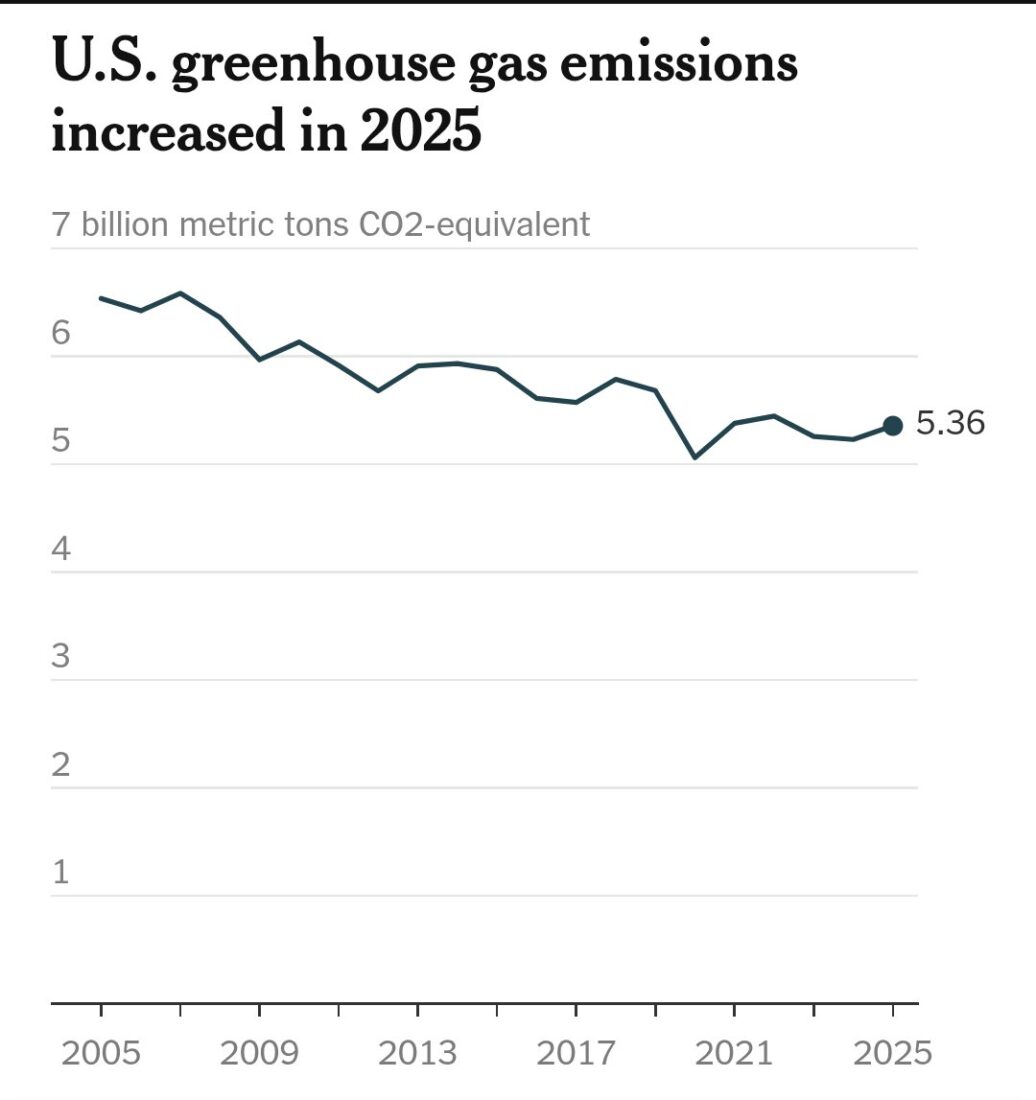
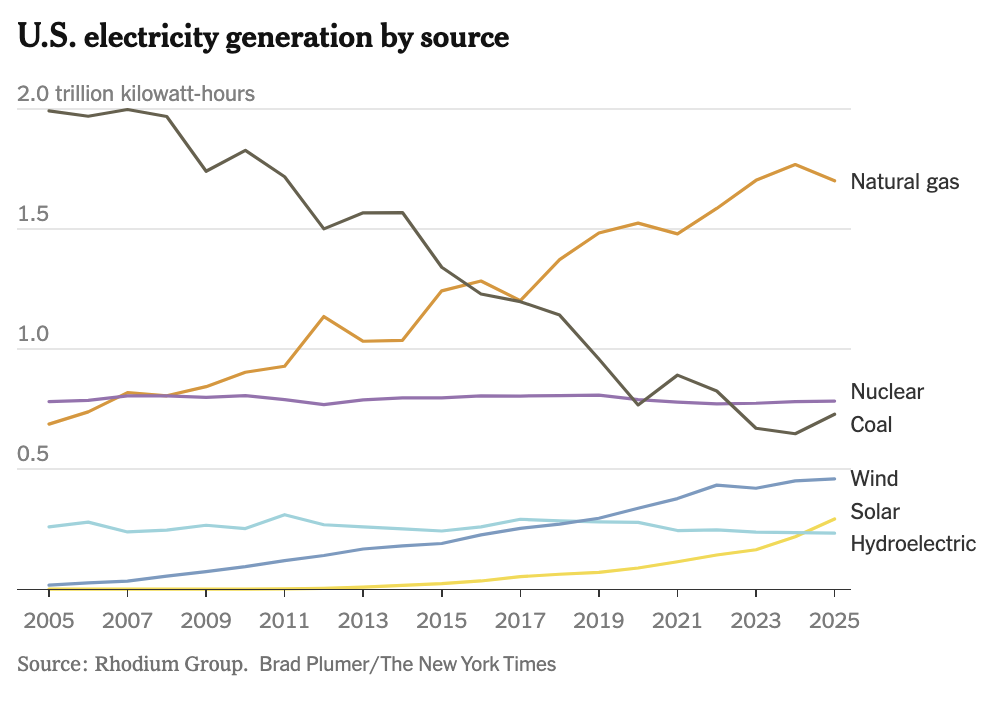 Figure 4 – US electricity generation by source, 2005-2025 (Source: NYT:
 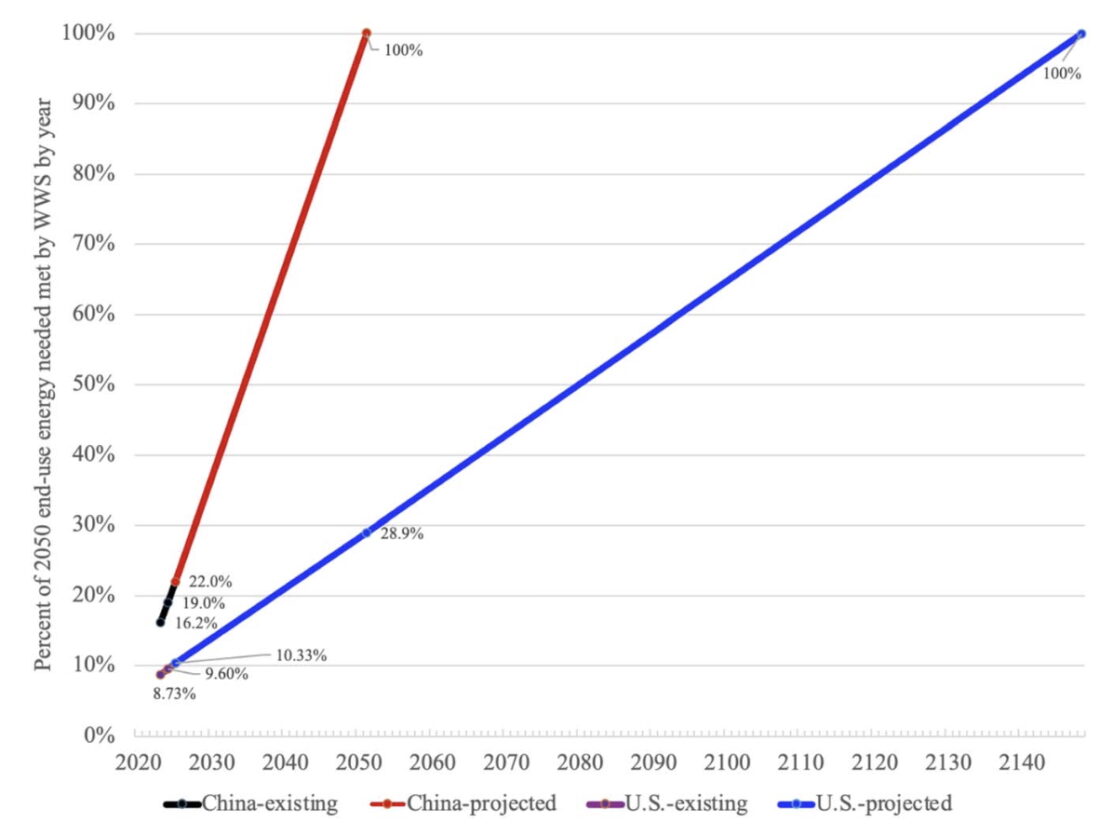 Figure 5 – Rate of energy transition, China vs. US, existing vs. projected
  Figure 1
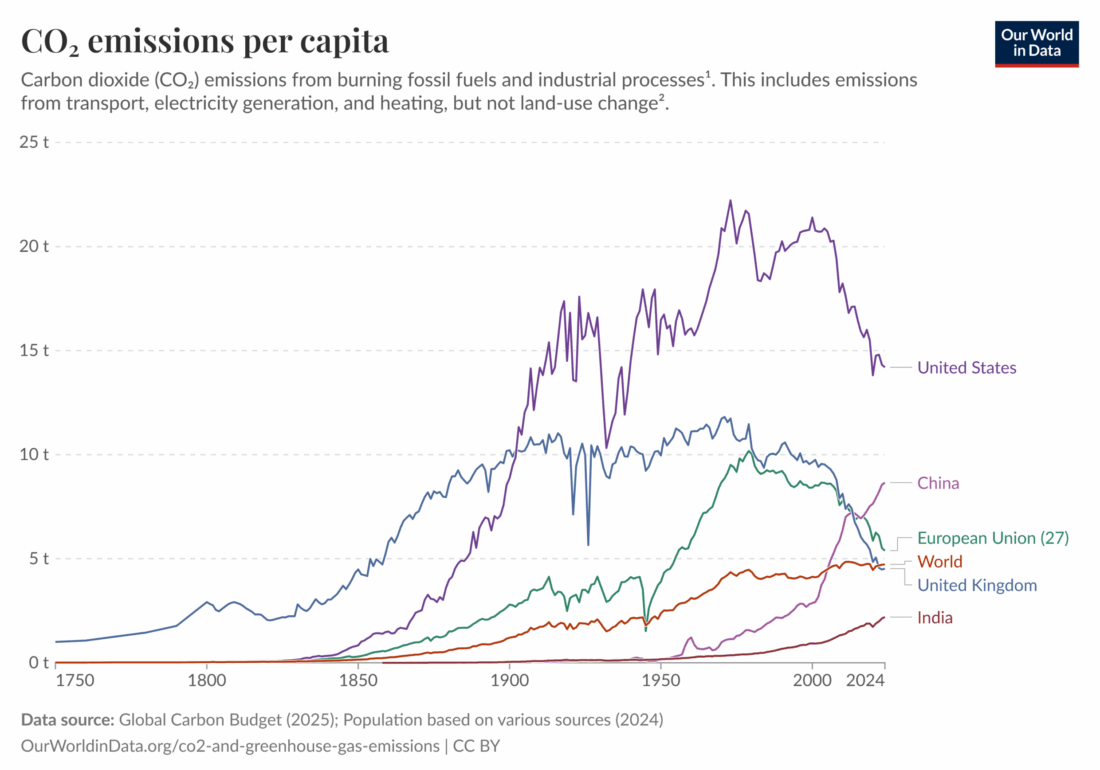 Figure 2
 Figure 3
 Figure 4
 Figure 5
 Figure 6


 Figure 4 –
 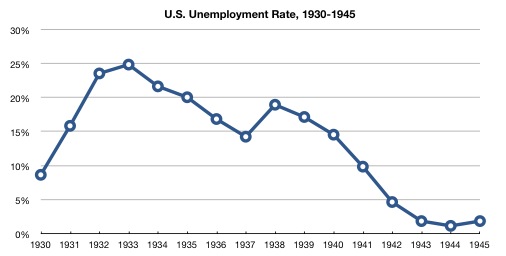 Figure 5 – US unemployment rate, 1930-1945 (

 Figure 1 – Past, now, and future
 Figure 2 –
  (Source: