The last two blogs focused on applying the IPAT identity to sub-country organizations. For obvious reasons, I started this analysis with a focus on oil companies and their supposed commitments to net-zero carbon emissions in the “near” (mid-century) future.
One of the main challenges for the oil companies is to balance their reliance on selling fossil fuels with their net-zero commitments. Many think that such a balance doesn’t exist but some of the oil companies are relying on carbon capture and storage (CCS) to prove that it does. Last week’s blog focused on incorporating CCS into the IPAT identity.
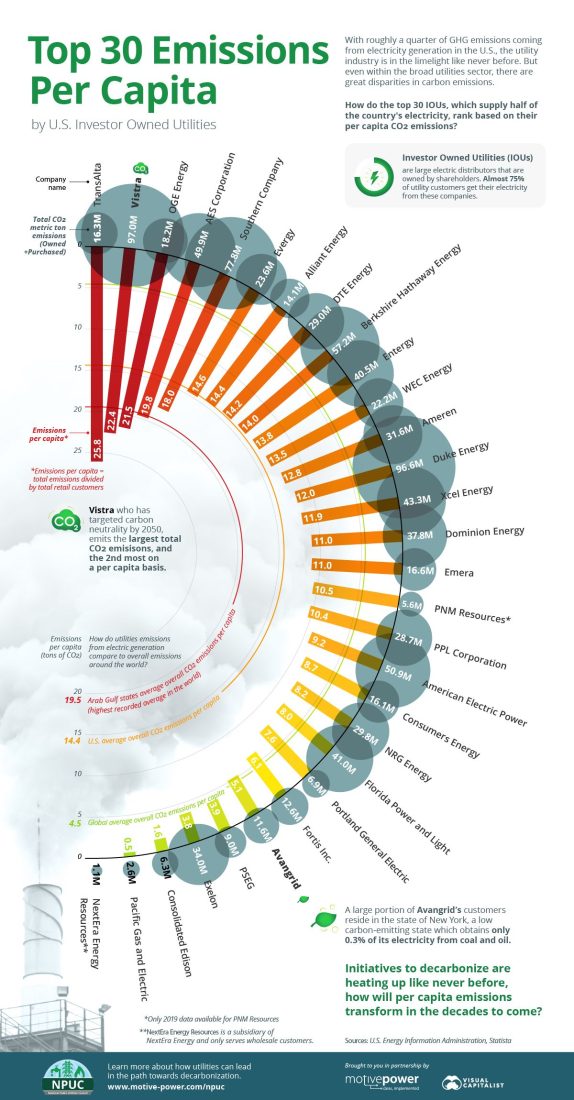
Figure 1 – Top 30 GHG emissions per capita by US investor-owned utilities (IOUs)
Numbers in gray circles represent total CO2 metric ton emissions, innermost numbers on bars represent emissions per capita (Source: Visual Capitalist)
In this week’s blog, I will focus on electric utilities. One of my reasons for doing is shown in Figure 1, taken from my favorite infographic site, Visual Capitalist. The figure illustrates the top 30 emissions per capita of the largest investor-owned utilities in the US. I live and work in NYC and we get our electricity from Con Edison. Our utility is doing very well on this chart and once I saw it, I forwarded it to the administrators of my school so they can be proud of being ConEd customers.
However, Figure 2 demonstrates the main reasons why we should care about how well the electric utilities are doing in reducing their carbon footprints. This figure, also posted by Visual Capitalist, is the best description that I am familiar with; it shows the importance of carbon-free electricity in the energy transition. It shows that the electricity generation sector takes the largest amount of energy in the US. More than that, as I have repeatedly mentioned throughout this blog, the flexibility of electricity use makes it the most important tool in the energy transition. The second-largest field of energy use is transportation. The shift to electric cars is mostly motivated by the claim that they use carbon-free energy; however, that depends on the availability of decarbonized electricity (examine the situation in China as it shifts to electric cars).
The industrial, commercial, and residential uses of energy are, to an important degree, associated with heating and cooling. Both functions can be accomplished using heat pumps driven by electricity. In other words, our ability to decarbonize our lives depends on our ability to decarbonize our electricity. In addition, one of the main impacts of climate change is water stress. In a world whose surface area is 70% ocean, one of our best ways to mitigate water stress is through desalination. However, the ability to alleviate water stress in this way while not contributing further to climate change is conditional upon decarbonized electricity sources.
In an earlier blog (June 29, 2021), I showed a figure similar to Figure 1, also from Visual Capitalist. However, that figure showed the “targets” of decarbonization by utilities, whereas Figure 1 shows the most recently available data (2020, with one exception of 2019).
Going back to IPAT, the identity (without the CCS term) looks like this:

We can learn from Figure 1 what the terms mean for companies: The “population” refers to the number of customers. The GDP is equivalent to revenues. The “energy” term applies to the primary energy used and the other two terms that list the kind of energy sources that are used have the same meaning as the original IPAT.
I will focus here on Consolidated Edison (ConEd or Con Edison) as an example.
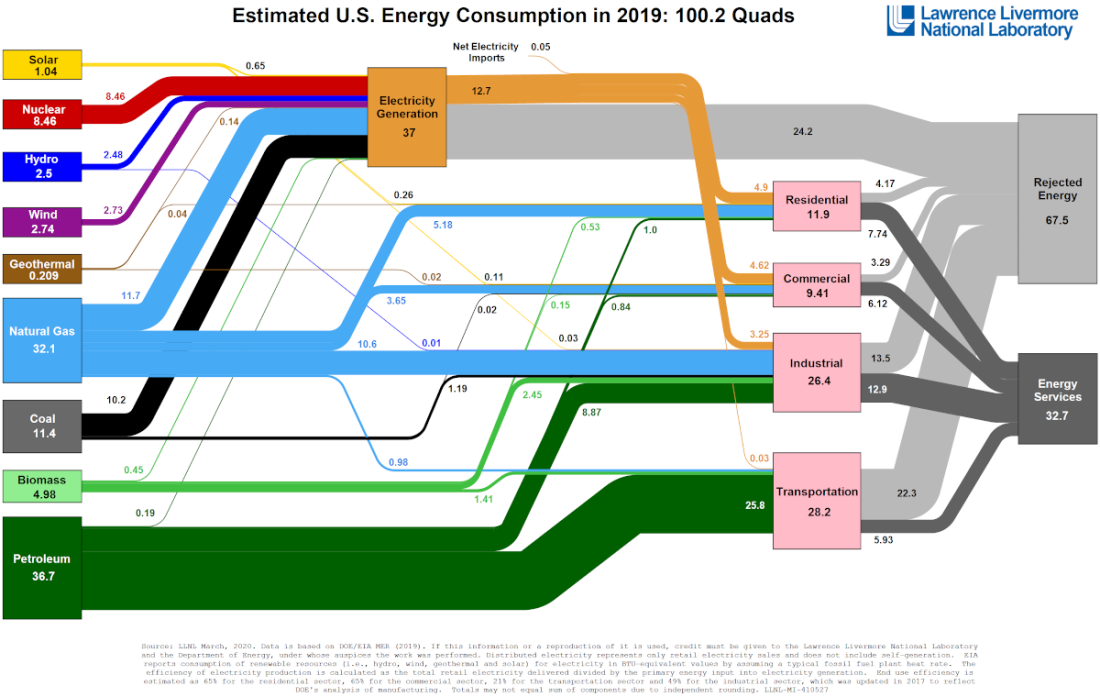
Figure 2 – Estimated US energy consumption in 2019 (Source: Lawrence Livermore National Laboratory, via Visual Capitalist)
Electricity is a secondary energy source that is produced from primary energy sources. The efficiency of the conversion is around 30%. The remaining 70% is rejected energy: heat (shown here in light gray). Since, as Figure 2 shows, our largest energy use goes toward electricity generation, any effort to decarbonize our energy use has to go through decarbonizing our electricity use.
If we get our electricity from an electrical utility, we must know how to handle the carbon balance of our utility. This form of emission is labeled as Scope 2 emission (June 18, 2019), indicating that we are not directly using the fossil fuel (Scope 1) but, instead, the product (electricity) that another party (electric utility) makes from it.
Since ConEd is my supplier of electricity both at home and at work, and since my state and city mandates now have laws demanding that both must reduce carbon emissions, I had to learn how to do so. Two blogs from exactly a year ago (May 25 and June 1, 2021) explored the procedure. The June 1 blog deals specifically with ConEd. As Wikipedia mentions, ConEd works through subsidiaries. As in that earlier blog, the main two subsidiaries that I will explore here are CECONY, which is regulated for its fuel mix by NYISO, and ConEd’s own subsidiary that is not regulated in terms of its fuel mix. Missing more detailed data, I am assuming that a smaller subsidiary, labeled O & R, which is focused on electricity delivery outside NYC, is included in the CECONY accounting. The fuel composition posted below is from the June 2021 blog:
CECONY [Consolidated Edison Company of New York] Fuel Mix Allocated by NYISO
- Natural Gas 51.1%
- Nuclear 37.5%
- Hydro 7.4%
- Other 1.3%
- Oil 1.1%
- Wind 1%
- Coal 0.3%
- Solar 0.2%
Con Edison Owned Generating Capacity (Total 3,463 MW)
- Solar 64.1%
- Natural Gas 21.4%
- Wind 12%
- Petroleum 2.5%
In its report, the ConEd-owned and generated subsidiary is called Clean Energy Business.
From Figure 1, I learned (not knowing previously which subsidiaries were considered), that the 2020 carbon emissions from ConEd were 6.3 million metric tons and the per capita emissions were 1.6 million metric tons. From that, I learned that the number of customers that were taken into account reaches nearly 4 million:
6,300,000/1.6 = 3,937,500
ConEd’s own website says they have 3.4 million customers.
ConEd is not only an electricity supplier; it delivers other services such as gas supply and grid services. I don’t have enough data to fine-tune the analysis.
The total electricity production for full-service customers and the total revenue are available in the annual 2021 report.
The company’s total 2021 revenue was listed as $13.7 billion, with a total energy of 20.7 billion kWh from CECONY and 7.52 million kWh from the Clean Energy Business. These numbers indicate that the actual energy delivered by the Clean Energy Business can be neglected compared to the CECONY delivery. So now we are in the position to calculate the carbon footprint of ConEd through the IPAT and compare it with the one calculated in Figure 1.
In the June 1, 2021 blog, we directly calculated the carbon intensity of ConEd based on their fuel composition. The result was that for every kWh delivered we must use 8000Btu of primary energy. If we neglect the contributions of the 1.1% oil and the 0.3% coal, putting all these numbers into the IPAT formula gives us 20 billion kWh. In this configuration, the only fossil fuel that ConEd uses to produce its electricity is natural gas, which accounts for 8×10¹³Btu of primary energy. If 1Btu of natural gas heat produces 0.063g of carbon dioxide, we can calculate the total carbon footprint of ConEd at 5 million tons of carbon dioxide, which roughly agrees with the value in Figure 1 (6.3 million tons).
For people who hate numbers, this is very complicated. To add to the complication, the reports that contain all this data are far from accessible. They are directed at investors, not students or readers who feel a need to follow the progress of the energy transition that we are forced to go through. As I mentioned in the last blog, ESG was designed to be a step toward allowing investors to consider social benefits as part of their investment considerations. In future blogs, I will try to correlate the IPAT perspective with ESG calculations.
However, there should be little argument about the importance of such analysis. A few days ago, the G7 (United States, Canada, France, Germany, Italy, Japan, and the United Kingdom, as well as the European Union) made a decision to “fully” decarbonize electricity by 2035, only allowing for fossil fuels based on the extent of available carbon capture
The G7, which represents the world’s biggest advanced economies, agreed on Friday to achieve “predominantly decarbonized” electricity sectors by 2035, a goal that experts say is a major step in helping the world avert catastrophic climate change.
G7 climate, energy and environment ministers made the new pledge in a 40-page communiqué at the conclusion of their meeting in Berlin, in which they also committed to an eventual phase-out of coal power generation, but gave no deadline for when they would do so.
The decision on decarbonization does, however, leave countries open to continue using fossil fuels if their greenhouse gases are “abated,” which means they emit less when burned, or “captured.” Current technology cannot capture 100% of greenhouse gases emitted by the burning of fossil fuels.
A fully decarbonized electric sector is the necessary condition for a fully decarbonized economy because, as I have mentioned often, almost all of our energy use comes from our use of convenient electricity.
I neglected the energy contribution of the Clean Energy Business of ConEd in the total energy analysis above because it is much smaller than that of CECONY. However, ConEd lists its capacity as 3,463 MW (million watts). This totals to 3.5GW (billion watts). If this capacity is available for energy delivery over a full year, it amounts to 30 billion kWh (3.5×109x360x24 = 3×10¹⁰kWh). This amount of energy is 50% higher than CECONY is delivering now. True, the Clean Energy Business sources of energy include 21.4% gas and 2.5% petroleum. However, electricity delivery has to include safety considerations (look at Europe in light of the Russian invasion) and price. ConEd has 13 years to eliminate these sources to serve as a working example for the rest of the utilities.