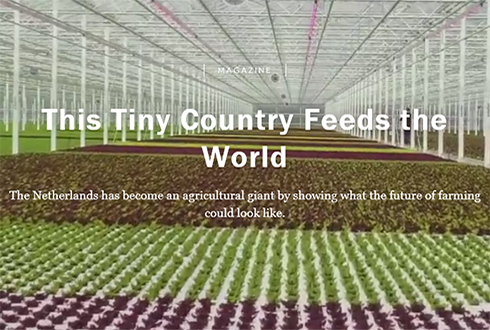
 Figure 1 – Indoor lattice growing setting from National Geographic magazine article
The photograph above resembles the one I included in last week’s blog. Both show the process of growing crops in a glass enclosure – except that Matt Demon’s preparation of Martian ground for farming was fiction while this is real.
This week I’ll look at long-term adaptation efforts we can take in light of the climate-related doomsday predicted to take place in the foreseeable future.
The two indicators I’ll concentrate on today are heat death and the end of food (see last week’s blog – October 17, 2017). I already gave heat death a quantitative treatment in my October 10th blog, when I talked about wet-bulb temperatures higher than 350C (950F). An “obvious” way to adapt to both of these dire problems is to follow Matt Damon’s example, growing our food and living our lives isolated from the outside environment. Up to a point, we can do it; we have the technology and it will not be that expensive to implement. Indeed, we only have to globally mimic the steps already being taken by a small rich European country: the Netherlands. Table 1 shows a few of the Netherlands’ important indicators.
Table 1 – The Netherlands, important indicators (Wikipedia)
| Indicators | Value | Rank |
| Population (2017) | 17,116,000 | |
| Population density | 413.3/km2 | 30 |
| GDP/Capita (Nominal – 2017) | $44,654 | 13 |
| Area | 41,543km2 | 66 |
I have good friends in the Netherlands and I like to visit the country as often as I can. Since almost half of the nation’s landmass is located at or below sea level, its residents have made and are continuing to make heroic efforts to protect themselves from flooding – both by the ocean and the large rivers that pass through the country on their way to the ocean. Almost every discussion throughout the world that concerns itself with adaptation to rising sea levels includes Dutch guests being invited to share their experiences. While I was already familiar with some of the strategies they use for flood abatement, I did not know about their efforts in greenhouse agriculture. When I got my September 2017 issue of National Geographic with an article on those efforts, I was stunned with admiration. All the beautiful photographs below come from that great article.
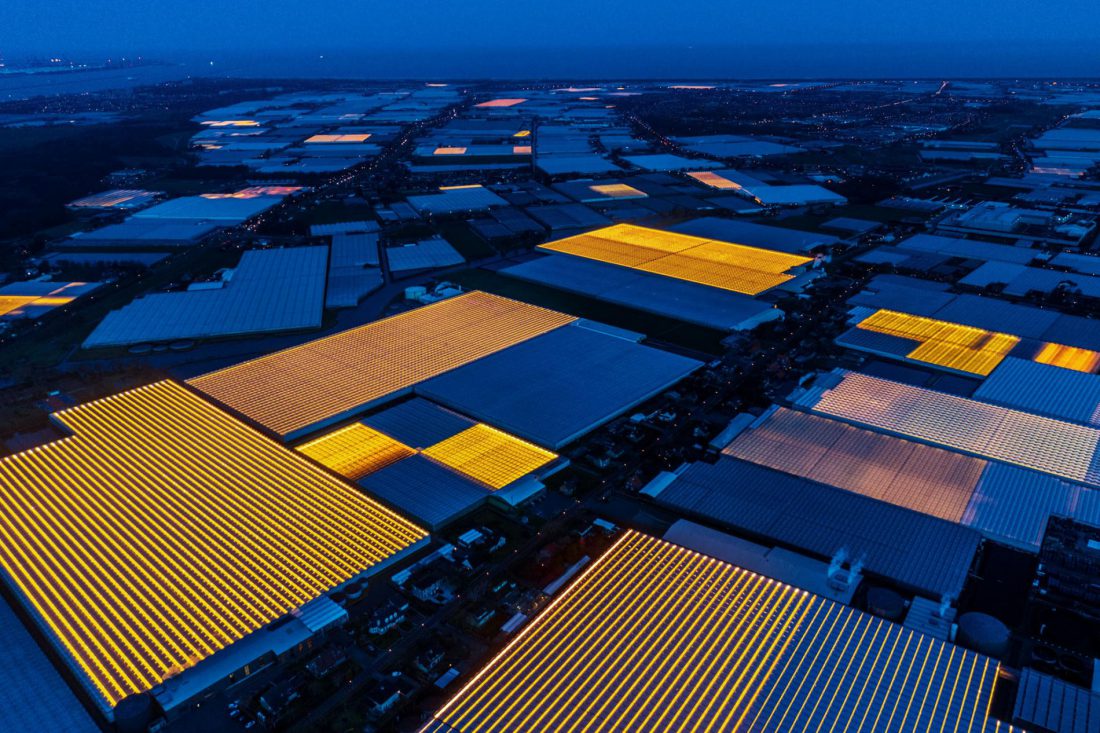
Figure 2 – Bird’s-eye view of greenhouses in the Netherlands
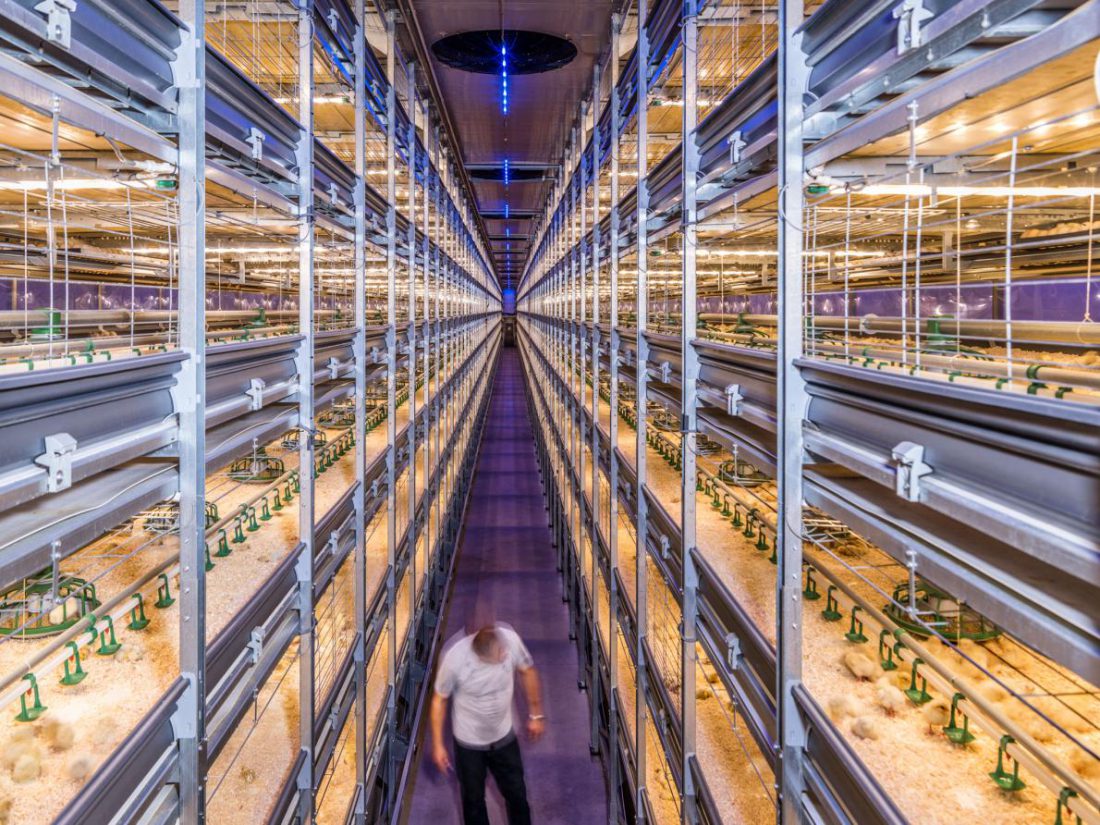
Figure 3 – Chicken growing facility
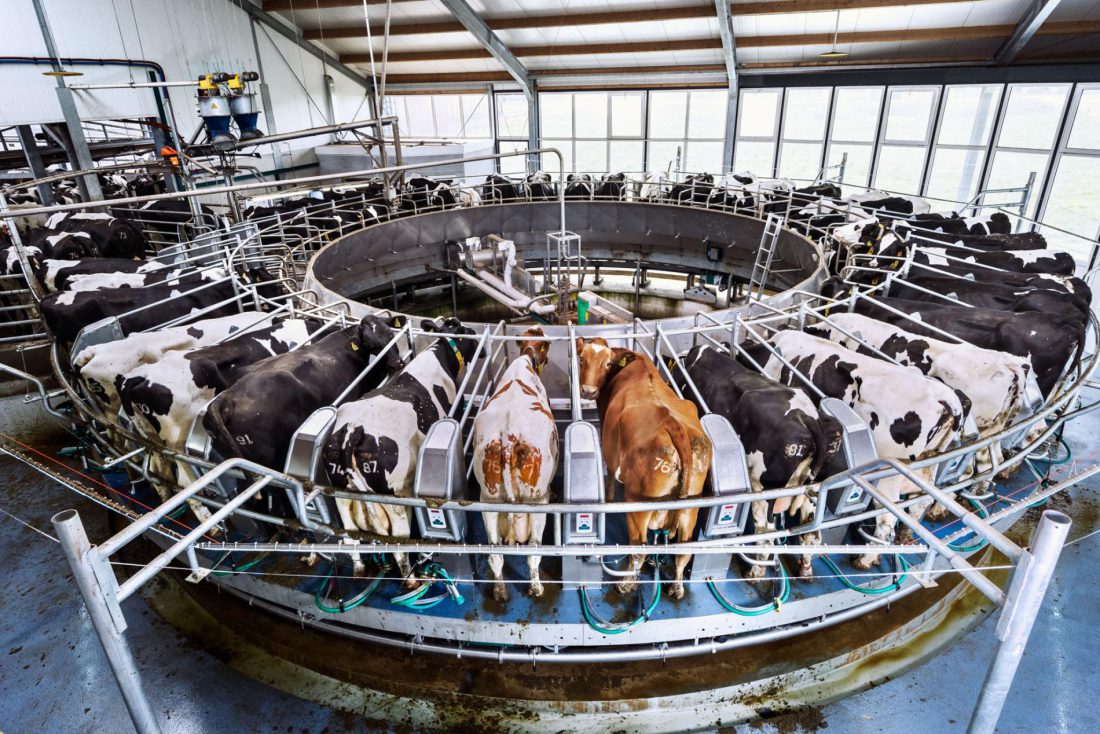
Figure 4 – A rotary milking machine
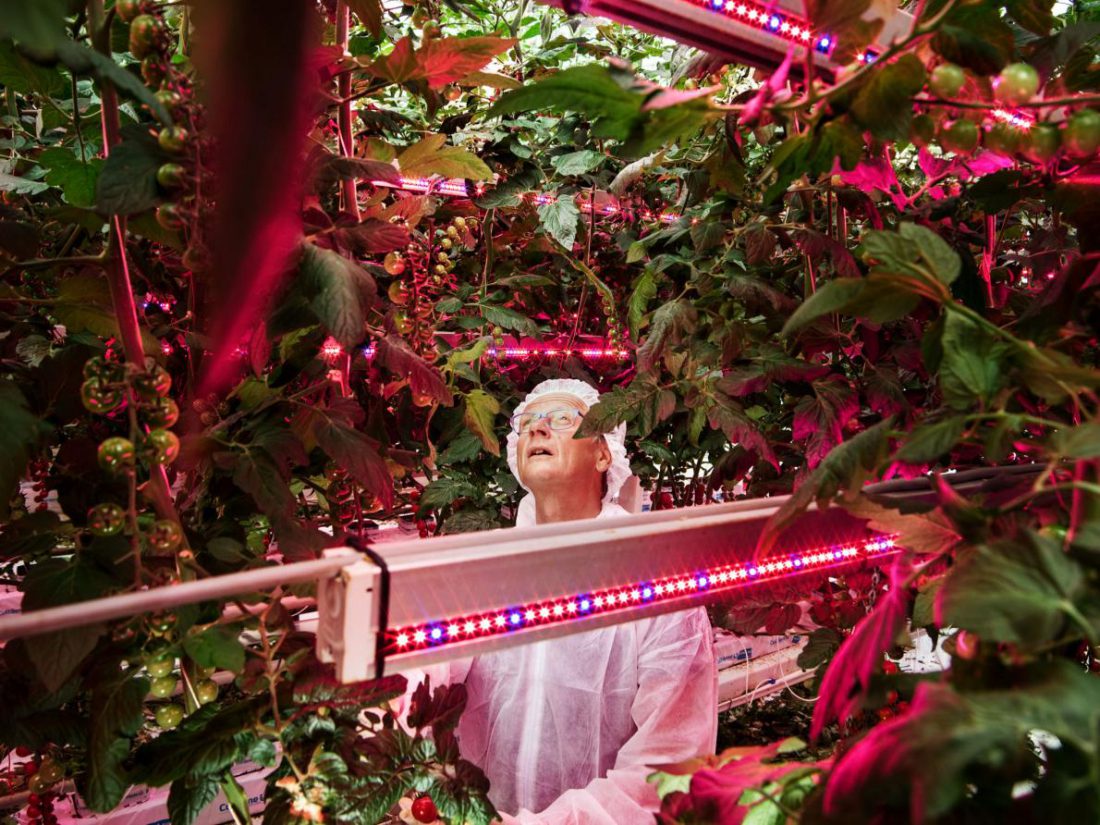
Figure 5 – Growing tomatoes
The effort is not only delightful to watch, it is also very efficient. Here is some statistical evidence of this success:
Table 2 – Total water footprints of tomato production (Gallons per pounds – 2010)
| Country | Footprints |
| Netherlands | 1.1 |
| US | 15.2 |
| Global Average | 25.6 |
| China | 34.0 |
Table 2 shows the water footprints of tomato production in the Netherlands, US, and China, together with the world’s average. The numbers are stunning and it is one of the best demonstrations of virtual water visualization I’ve seen. I introduced the concept of virtual water here several years ago (November 18, 2014):
The two main inventories that are included in most analyses are energy and water. Both inventories suffer from the same broad range of values as measured in different facilities. I just recently returned from a conference in Iceland in which I presented our work on water stress (“The Many Faces of Water Use” by Gurasees Chawla and Micha Tomkiewicz; 6th International Conference on Climate Change, Reykjavik, Iceland (2014)). One of the issues that we discussed there was the concept of virtual water: the “sum of the water footprints of the process steps taken to produce the product” – an idea that constitutes part of the LCA analysis of products. For instance, the typical virtual water of fruits is 1,000 m3/ton. To remind us all, the weight of pure water in these units is 1ton/1m3, so the weight of the virtual water is 1,000 times the weight of the product itself. Where did the extra water go? For the most part, it either became waste water or evaporated.
Yes they are blaming the US for the depletion of Mexican water but in fact they should blame themselves because they are subsiding the Mexican strawberries growers by not charging them anything for the water that they use so that they will be able to better compete against the American growers.
Here’s one example of the concept of virtual water, as given in an article in a Mexican science magazine: when the US imports strawberries from Mexico, the imported strawberries conceptually “carry” with them all the virtual fresh water that is so greatly needed in both countries (Camps, Salvador Penische and Patricia Ávila García, Revista Mexicana de Ciencias 3:1579 (2012)); this equates to the US “stealing” water from the Mexicans. As a result, some are blaming the US for the depletion of Mexican water, and charging our country with immoral economic capitalism.
Meanwhile when proper water management is being used (mainly waste water treatment), the virtual water can be reduced by 90%.
Table 3 – The Netherlands’ yield of various agricultural products and its rank in comparison to the rest of the world – 2014
| Produce | Tons per square mile | Rank |
| Carrots | 17,144 | 5 |
| Chilies and green peppers | 80,890 | 1 |
| Cucumbers | 210,065 | 1 |
| Onions | 13,037 | 6 |
| Pears | 11,582 | 2 |
| Potatoes | 13,036 | 6 |
Table 4 – Rank in various categories of tomato production
| Rank | Category | Quantity |
| 1 | Yield | 144,352 tons/square miles |
| 22 | Total production | 992,080 tons |
| 95 | Area harvested | 6.9 miles2 |
Table 5 – Changes in vegetable growing practices from 2003-2014
| Vegetable Production | +28% |
| Energy used | -6% |
| Pesticides used | -9% |
| Fertilizers used | -29% |
The efforts of the Netherlands in this area are being recognized throughout the world and visitors from many developing countries are visiting to try to learn from the Dutch so they can try to implement the same methods back home. A global map in the article demonstrates the reach of these efforts.
This shift to enclosed agricultural methods and similarly isolated living structures as a response to increasingly uninhabitable lands can only be effective if the structures are cooled to the temperatures necessary for people and crops to continue thriving. This will, in turn, require the use of cooling devices and energy sources that will not amplify the damage. Cooling devices have their own limits, as I will explain in future blogs.
I think this is a prime example of adaptation, however I realize that a lot of resources were put initially, which Netherlands could afford. But since they did all the prep work, I do not see why not this Cann’t be use virtually everywhere. Water is one of those resources that is not talked as much, unless the area is in dire need. Americans barely pay for it, there is no incentive to save it and love for meat and other consumer products (and the amount of food waste) is not helping. More attention needed from government to take great examples as listed above and implementing It as well as to start tp pay attention to a water crisis.