Last week, when I discussed the new $2.3 trillion “American Jobs Plan,” I listed the costs of items that directly address climate change mitigation. The second most expensive item was the $174 billion program for electric vehicle incentive. A few years ago, I wrote a set of three blogs (March 12–26, 2019) that examined the sustainability of electric cars. I concluded that these cars are only as sustainable the electric grids that feed them. The Biden administration knows this is true. On another occasion, President Biden declared his intention for US electrical utilities to be carbon free by around 2035. Since the approximate lifetime of an electric power plant is about 20 years, this timeline would mean that every new power plant we build now must be carbon free. This week, I am trying to figure out where we stand on this issue—both on international and national levels.
Figure 1, taken from the International Energy Administration (IEA), shows the changes in the installed power generation capacity from the beginning of this century, extrapolated to 2040 based on IEA’s 2019 Stated Policy Scenarios.
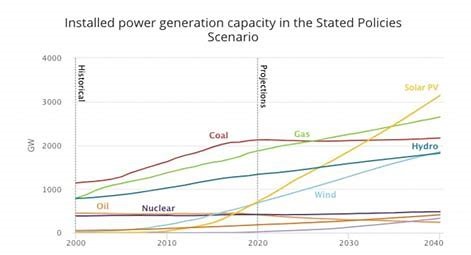
Figure 1 – Power generation capacity by type
EIA summarizes the projected data in Figure 1:
The expansion of generation from wind and solar PV helps renewables overtake coal in the power generation mix in the mid-2020s. By 2040, low-carbon sources provide more than half of total electricity generation. Wind and solar PV are the star performers, but hydropower (15% of total generation in 2040) and nuclear (8%) retain major shares.
If the world is to turn today’s emissions trend around, it will need to focus not only on new infrastructure but also on the emissions that are “locked in” to existing systems. That means addressing emissions from existing power plants, factories, cargo ships and other capital-intensive infrastructure already in use. Despite rapid changes in the power sector, there is no decline in annual power-related CO2 emissions in the Stated Policies Scenario. A key reason is the longevity of the existing stock of coal-fired power plants that account for 30% of all energy-related emissions today.
Figures 2 and 3, taken from the American Energy Information Administration’s (EIA) Annual Energy Outlook 2021, show the expected electricity generation in the US, over approximately the same period.
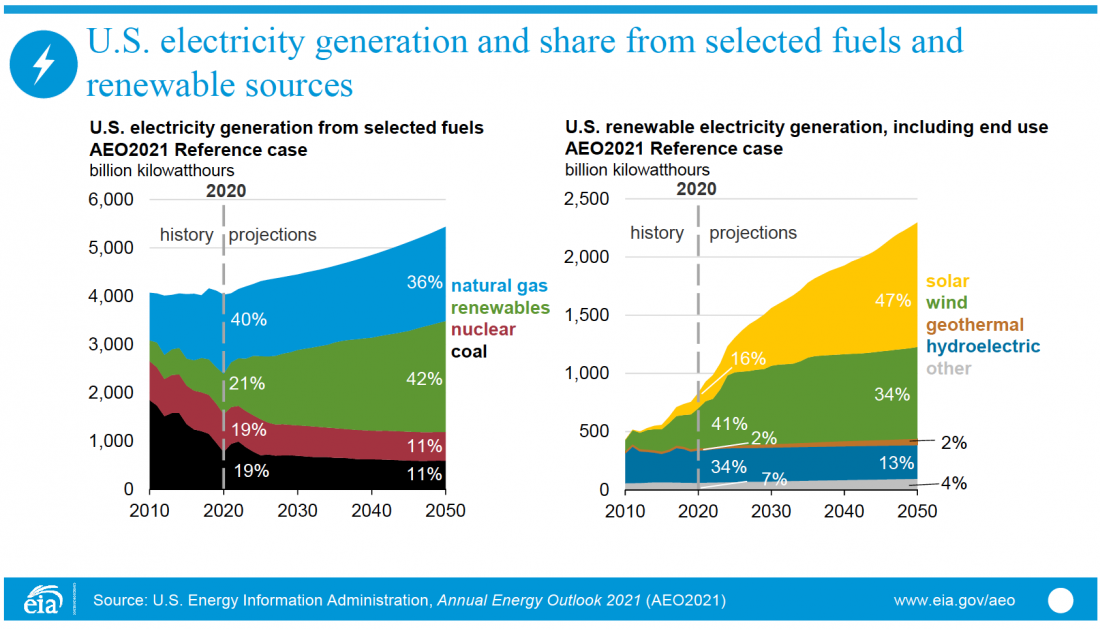
Figure 2
According to Figure 2, renewable energy production is projected to dwarf both nuclear and coal by 2050, with natural gas trailing close behind. Within that renewable label, solar and wind both see significant increases.
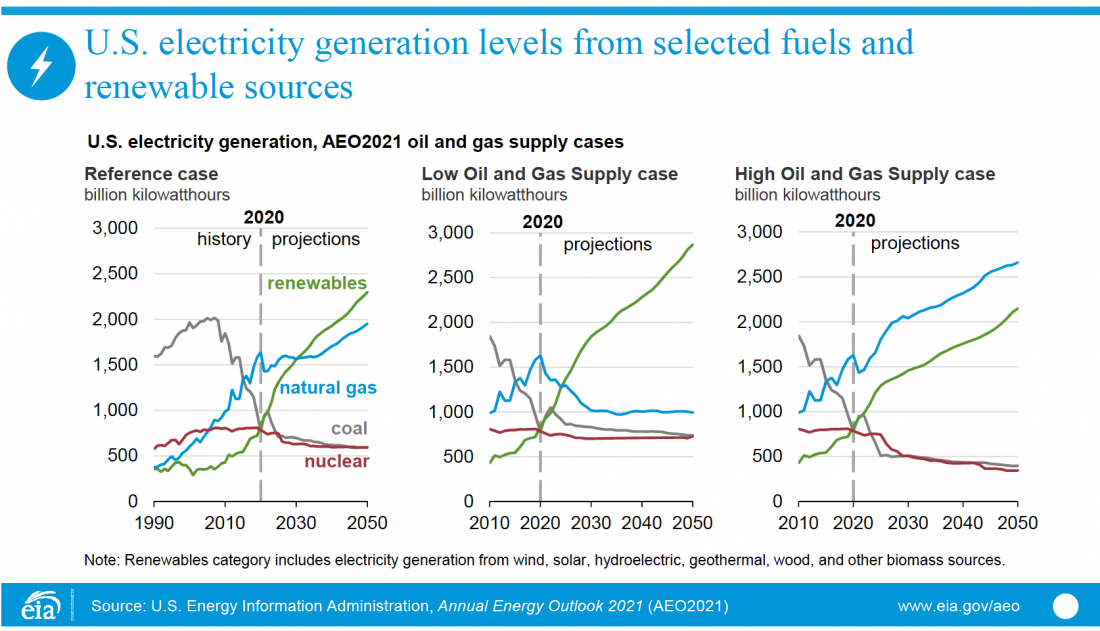
Figure 3
Interestingly, Figure 3 shows that the extrapolated competition between natural gas and zero-carbon power stations sources depends a lot on the available supply of natural gas. In other words, reducing the availability of natural gas could be an excellent mitigation policy. Unfortunately, no one else seems to be investigating this option.
None of these scenarios predict that the US will successfully reach zero-carbon electricity generation within President Biden’s timeline. However, both the internationally declared scenario in Figure 1 and the low gas supply scenario in Figure 3 predict that sustainable, carbon-free power will soon be on its way to dominating electricity production in the US.
However, recent results by the US National Oceanic and Atmospheric Administration (NOAA), show that even the American Jobs Plan’s proposed pace of slowing carbon emissions might not be fast enough. COVID-19 almost immobilized the world and there are predictions that there was resulting decline in carbon emissions around 7% over the last year. Unfortunately, we have not seen any sign from direct measurements of carbon dioxide and methane in the atmosphere that their levels have been significantly affected. Figures 4 and 5 show the results, followed by some possible explanations from NOAA.
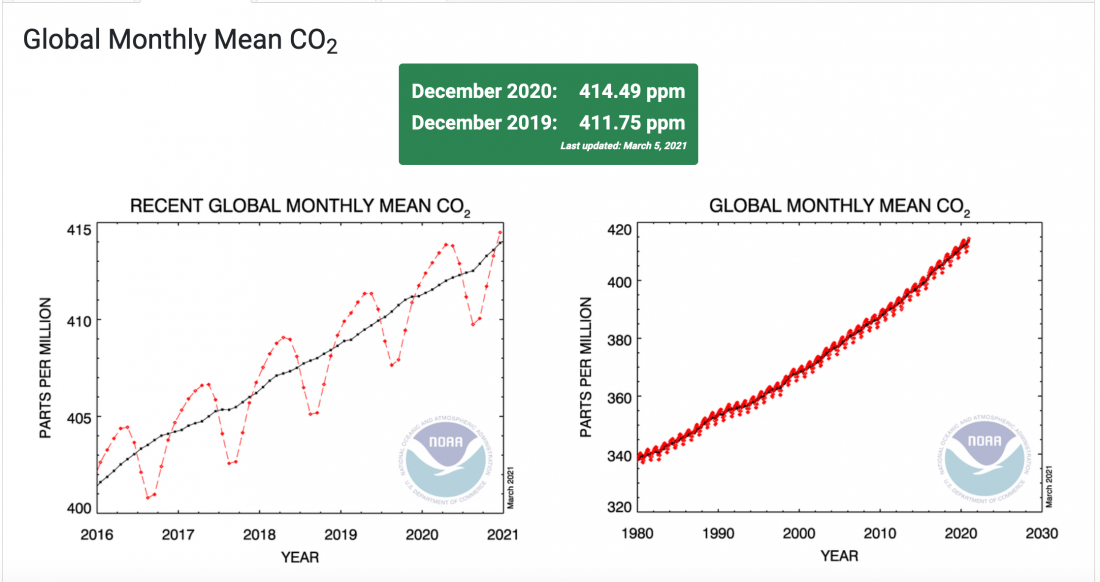
Figure 4 – Global monthly mean of carbon dioxide
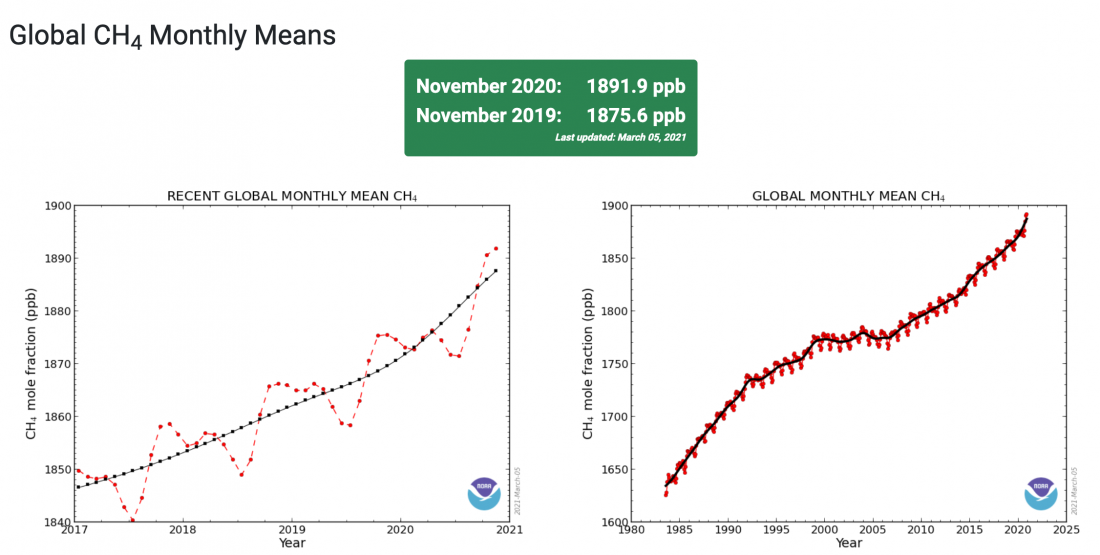
Figure 5 – Global monthly mean of methane
The economic recession was estimated to have reduced carbon emissions by about 7 percent during 2020. Without the economic slowdown, the 2020 increase would have been the highest on record, according to Pieter Tans, senior scientist at NOAA’s Global Monitoring Laboratory. Since 2000, the global CO2 average has grown by 43.5 ppm, an increase of 12 percent.
The atmospheric burden of CO2 is now comparable to where it was during the Mid-Pliocene Warm Period around 3.6 million years ago, when concentrations of carbon dioxide ranged from about 380 to 450 parts per million. During that time sea level was about 78 feet higher than today, the average temperature was 7 degrees Fahrenheit higher than in pre-industrial times, and studies indicate large forests occupied areas of the Arctic that are now tundra.
Methane in the atmosphere is generated by many different sources, such as fossil fuel development and use, decay of organic matter in wetlands, and as a byproduct of livestock farming. Determining which specific sources are responsible for variations in methane annual increase is difficult. Preliminary analysis of carbon isotopic composition of methane in the NOAA air samples done by the Institute of Arctic and Alpine Research at the University of Colorado, indicates that it is likely that a primary driver of the increased methane burden comes from biological sources of methane such as wetlands or livestock rather than thermogenic sources like oil and gas production and use.
“Although increased fossil emissions may not be fully responsible for the recent growth in methane levels, reducing fossil methane emissions are an important step toward mitigating climate change,” said GML research chemist Ed Dlugokencky.
The NOAA results are certainly worrying but they are still preliminary at this stage. Of particular concern are the methane results. As a reminder, the radiative forcing per molecule of methane is 20 times bigger than that of carbon dioxide. In other words, not only must we work to significantly reduce methane emissions, we must also pay special attention to them into our mitigation plans.
thanks for sharing
The situation seems bleak when the American Jobs Plan has bold plans that seem unlikely and even those plans may not be enough to have a serious effect. I would like to see more on nuclear power as I am sure you have written about it. Reducing natural gas seems like a political nonstarter at the moment. Even reducing coal is hard to bring up without angering the entire Midwest. I like the Biden administration approach of selling climate policies as a way to increase jobs and make us competitive with China.
I am curious why you are proposing reducing natural gas supplies before eliminating coal as a power source? Also what about SMR? I know we all grew up with the Cold War threat of the A bomb and Chernobyl but 21st century Techologies could displace our carbon based fuels for our base load needs and the electric vehicle infrastructure.