The high concentration of natural disasters taking place all over the world includes:
- Hurricanes and cyclones such as Harvey, with its flooding of Houston and the rest of Southern Texas and Louisiana, Maria and its devastating destruction of Puerto Rico and other Caribbean islands, Irma and its impact on Florida, and the flooding in India, Pakistan, and Nepal
- Mudslides in Sierra Leone
- Deadly Mexican earthquakes
- Bushfires in Queensland, Australia, where temperature reached 42.5oC (109oF), the Canary Islands, and Southern California
These have resulted in the combined loss of hundreds of lives, the displacement of millions who have lost their homes, and collective fiscal losses that are fast approaching trillions of dollars. The recovery will take months if not years.
For people directly affected, the impacts certainly felt like doomsday, the end of the world, the Sixth Extinction, or whatever else you are inclined to call a global calamity. For the new GOP Senate candidate from the State of Alabama, all of these are just signs of God’s unhappiness the human race for engaging in certain activities (of which Mr. Moore does not approve).
In the last few blogs, I have dealt with various aspects of future impacts of our activities on the physical environment and how they will result in global doomsday. I have phrased it as occurring in the near future that I defined broadly as “now”: within the lifetime of my grandchildren. Here we are talking about the literal “now” in local communities, countries and regions.
A valid question to ask is how do we know (and how sure are we) that human activity has made a significant contribution to these existential disasters – which means that some of the dangers are within our power to mitigate.
Here is how Wikipedia defines attributions of climate change:
Attribution of recent climate change is the effort to scientifically ascertain mechanisms responsible for recent climate changes on Earth, commonly known as ‘global warming‘. The effort has focused on changes observed during the period of instrumental temperature record, when records are most reliable; particularly in the last 50 years, when human activity has grown fastest and observations of the troposphere have become available. The dominant mechanisms are anthropogenic, i.e., the result of human activity. They are:[3]
- increasing atmospheric concentrations of greenhouse gases
- global changes to land surface, such as deforestation
- increasing atmospheric concentrations of aerosols
There are also natural mechanisms for variation including climate oscillations, changes in solar activity, and volcanic activity.
According to the Intergovernmental Panel on Climate Change (IPCC), it is “extremely likely” that human influence was the dominant cause of global warming between 1951 and 2010.[4] The IPCC defines “extremely likely” as indicating a probability of 95 to 100%, based on an expert assessment of all the available evidence.[5]
As the scope of the climate events changes, so will the way in which we attribute human contributions. The attribution of global climate change will also be different than that of local weather events. Attributions will likewise differ for past events and predicted future events.
According to the IPCC, its measurements of our historical impacts on the global climate make it 95% certain of humans’ dominant contributions to climate change. A summary of the IPCC report of human contributions can be found here.
Visual summaries of the various observations are given in Figures 1 and 2.
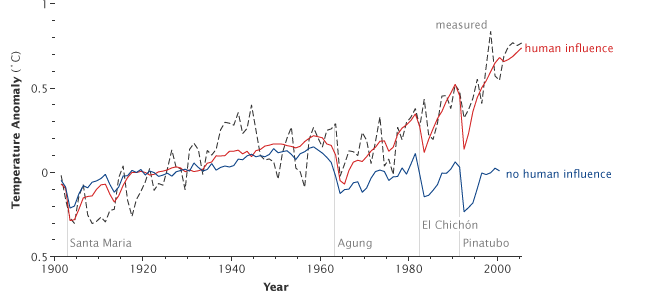
Figure 1 – Attribution of global warming – simulation of 20th century global mean temperatures (with and without human influences) compared to observations (NASA)
Figure 1 shows a computer analysis of observed global temperature change over the 20th Century. The analyses of conditions with and without human contributions show only short-term fluctuations until mid-century, after which they split sharply. Toward the end of the century the global temperature without human contributions is a bit lower than in the beginning – a difference attributed mainly to the impact of volcanic eruptions (which result in a slight cooling immediately afterward). The observed temperature change is close to 1oC, in agreement with that calculated to include human contributions. In the case that exactly 100% means full accounting for the temperature increase relative to the prediction of slightly lower temperatures without human contributions, this shows a human contribution to climate change of more than 100% over this period.
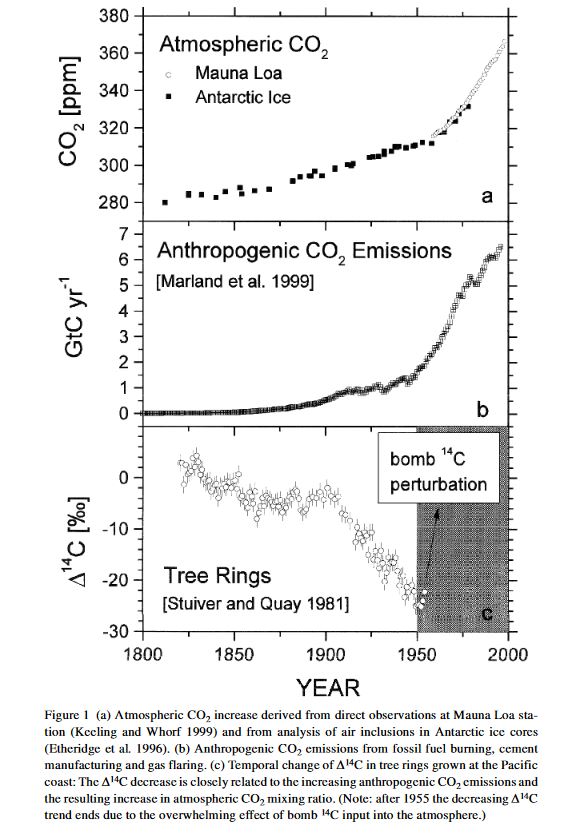
The main forcing mechanism of human contribution to the climate is the carbon dioxide emitted through burning of fossil fuels. Figure 2 shows the correlations between the measured changes of the atmospheric concentrations of carbon dioxide compared with the human-caused emissions. The curves look similar in shape; both of them kick sharply up in the middle of the 20th Century. Unfortunately, the two curves are shown in different units so direct comparisons are impossible. I am teaching my General Education students how to make such comparisons, using the tools from my book, Climate Change: The Fork at the End of Now. I am not going to repeat the calculation here. You will have to take my word that the jump in atmospheric concentration of carbon dioxide from 1950 to 2000 taken from the figure amounts to about 0.4 trillion tons of carbon dioxide while the human emissions amount to 0.5 trillion tons of carbon dioxide. These numbers are a rough approximation but are close enough to convince us that they are closely related. Section c of the same figure provides probably the most convincing evidence for the origin of this extra carbon dioxide.
Here is the background:
14C is a radioisotope of carbon with atoms that contain 6 protons and 8 neutrons as compared to the more abundant isotope of carbon (12C), which contains 6 protons and 6 neutrons. The radioisotope is unstable and slowly converts to nitrogen (14N) by converting one neutron to one proton. The conversion rate is measured through a parameter called half-time. It means that if we start with a certain amount of the material, half of it will convert into 14N in that period of time. The half-life of 14C is 5,730 years. The natural abundance of this isotope in the atmosphere is about one atom in a trillion. Plants that grow by photosynthesis of carbon dioxide in the atmosphere end up with the same amount of the carbon isotope.
Combustible fossil fuels such as coal, natural gas (mainly methane), gasoline, and various oils, are deposits of organic materials formed from decayed plants and animals. These organisms were alive many millions of years ago – way longer than 5,730 years – so all of their 14C had plenty of time to decay completely. In other words, any emissions of this type of more stabilized carbon dioxide into the atmosphere should reduce the atmospheric concentration of 14C. This reduction is shown in Figure 2c. Unfortunately, this experiment had to stop around mid century because of the prevalence of nuclear atmospheric testing at that time, which added a great deal of 14C to the atmosphere. We are left with the convincing data up until that time. Most of the carbon dioxide that we added to the atmosphere until that time came from combustible fossil fuel use. Carbon dioxide is the main anthropogenic greenhouse gas connected to our energy use (see June 25, 2012 blog or search for “greenhouse gas emissions” throughout the blog). The increase in temperature shown in Figure 1 came mostly from that same addition of carbon dioxide to the atmosphere from burning those fossil fuels.
The increase in temperature has immediate consequences.
Figure 3 shows one important consequence of an increase in average temperature. It shows two identical distributions of temperature over the same time period with a small shift to an overall higher temperature. If we define an extreme heat event through frequency of a fixed high temperature such as 100oF (how many days in a year we reach that target temperature or higher), the figure clearly shows that the probability of the extreme event increases greatly.
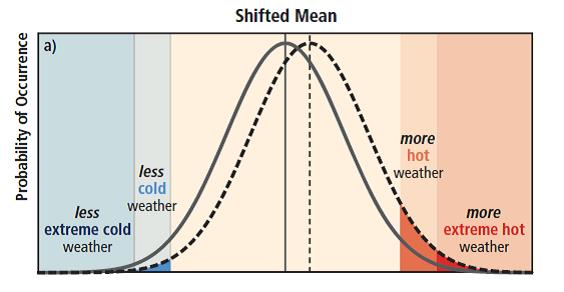 Figure 3 – Attribution of Extreme Weather Events in the Context of Climate Change
The anthropogenic increase in global temperature has other direct implications.
A vital implication from an important law in Physical Chemistry called the Clausius Clapeyron Equation tells us that the vapor pressure of almost all liquids steadily increases as the temperature increases. That means that the amount of humidity in the atmosphere is increasing as we warm the planet. Most of the impacts of the increase in global temperature manifest themselves through the water cycle: rise in sea level, increased desertification through enhanced transpiration and heightened land evaporation, shifts in precipitation patterns, etc.
Next week I will focus on how climate change is impacting some specific areas as well as some steps that we need to take right now to mitigate (minimize) and adapt to these dangers.