Figures 1 and 2 show the countries and US states most affected by climate change. This blog is focused on the criteria that are used for this ranking, while the next blog will focus on some of the list’s immediate consequences.
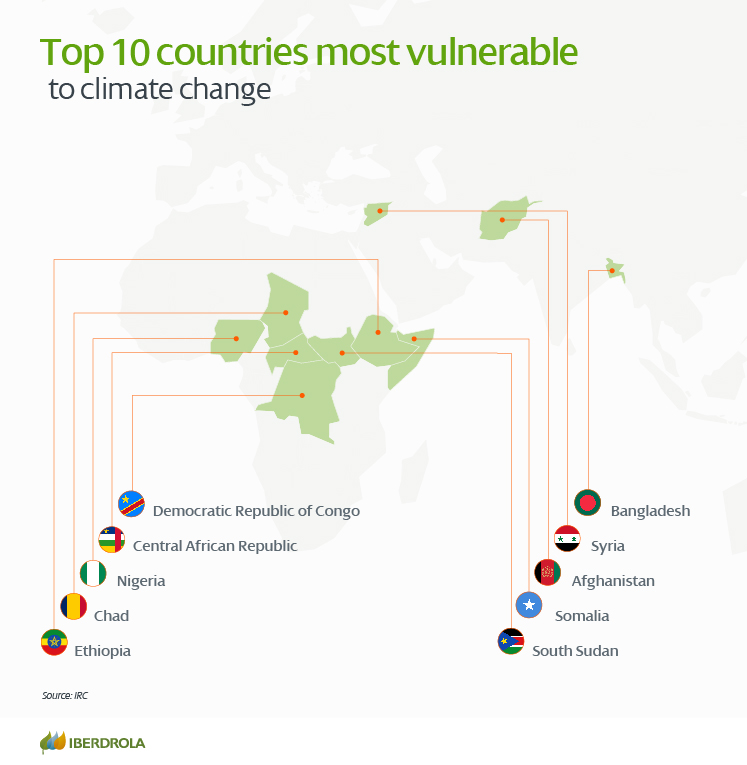 Figure 1 – The 10 countries most threatened by climate change in the 21st century (Source: IRC via Iberdrola)
The link below Figure 1 defines and describes the background of the countries’ rankings, as defined during the COP27 meeting. Defining these vulnerabilities was both difficult and controversial, as summarized in the paragraph below:
The vulnerability criteria provoked controversy between one side, consisting of China and emerging countries, and the other, consisting of the European Union. The problem stemmed from what was considered vulnerable to the effects of climate change and therefore who should receive support from the international community. Because of this debate, it is necessary to investigate which countries are most likely to be affected in the event of a climate disaster, with no chance of recovery. Cases such as the United States or Australia, where phenomena usually cause adverse effects, but because they are countries that have the capacity to respond, are ruled out by studies related to vulnerability.
Per definition, the most vulnerable countries are developing countries that have no means of mitigating the inflicted damage. Details about the specifics of the vulnerabilities of these countries can be found in the original publication.
An alternative list of the most affected countries is given by Germanwatch and is summarized in Table 1:
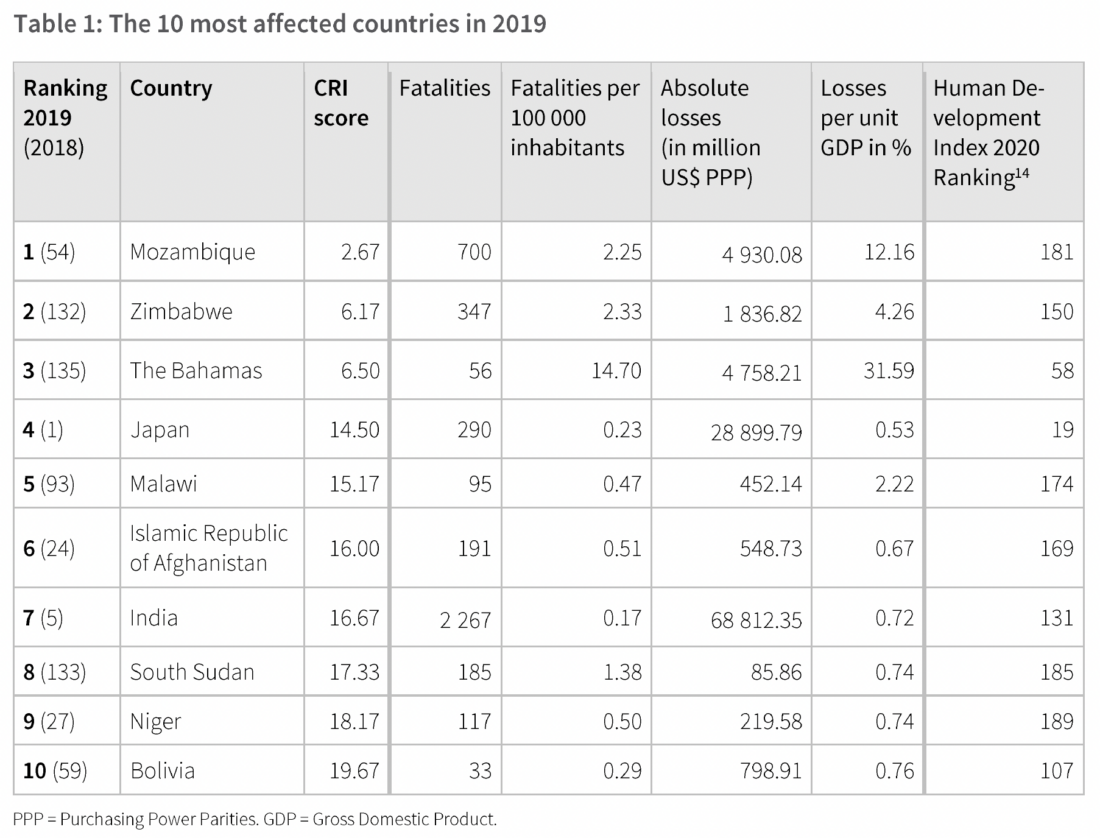 This ranking is independent of the ability to mitigate the damage, but with one exception (Japan) also includes only developing countries. This ranking is based on the Global Climate Risk Index (CRI), summarized below from the Germanwatch Global Climate Risk Index 2020:
The Global Climate Risk Index (CRI) developed by Germanwatch analyses quantified impacts of extreme weather events9 – both in terms of fatalities as well as economic losses that occurred – based on data from the Munich Re NatCatSERVICE, which is considered worldwide as one of the most reliable and complete databases on this matter. The CRI examines both absolute and relative impacts to create an average ranking of countries in four indicating categories, with a stronger emphasis on the relative indicators (see chapter “Methodological Remarks” for further details on the calculation). The countries ranking highest (figuring in the “Bottom 10”10) are the ones most impacted and should consider the CRI as a warning sign that they are at risk of either frequent events or rare, but extraordinary catastrophes.
The CRI does not provide an all-encompassing analysis of the risks of anthropogenic climate change, but should be seen as just one analysis explaining countries’ exposure and vulnerability to climate-related risks based on the most reliable quantified data available – alongside other analyses. 11 It is based on the current and past climate variability and – to the extent that climate change has already left its footprint on climate variability over the last 20 years – also on climate change.
Another ranking in the same publication is focused on long-term climate risk. The 10 most vulnerable countries in that list are also developing countries.
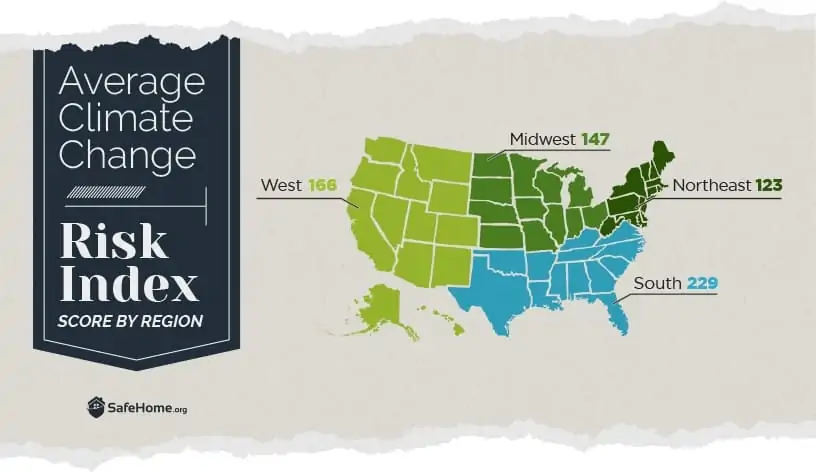
Figure 2 – Map of US states average climate change risk index score by region
(Source: SafeHome.org)
The methodology used in drafting Figure 2 is summarized at the end of the original article on SafeHome.org and is quoted below:
All of the data used in our analysis came from the excellent work of Climate Central and a site it maintains, States at Risk, which is a clearinghouse of data and analysis related to the impacts of climate change on the states. We excluded Alaska and Hawaii from our analysis because not enough data was available for either one to draw fair comparisons.
The site lists dozens of impacts for states and, often, multiple cities within the states, but the factors we included in our Climate Change Risk Index were:
- Increased mosquito season days, 1980s to today
- Dangerously hot days by 2050 (days with heat index of at least 105 degrees) in state or largest city
- Percentage of people vulnerable to extreme heat
- Increase in severity of widespread summer drought, 2000-2050
- Percentage of people currently affected by inland flooding (percentage living in 100-year floodplain)
- Increase in days with high wildfire potential, 2000-2050
- Percentage of population at elevated wildfire risk
- Percentage of people currently affected by coastal flooding (percentage living in 100-year coastal floodplain)
The data for each state was ranked from best to worst, and each state’s rank in all the categories were added together to create the overall ranking in which lower scores equate to lower risk from climate change.
The approaching “judgments” of these vulnerabilities will be discussed in the next blog. In a series of blogs that started on September 12th and ended on October 3rd, I focused on related issues such as developed countries’ commitments to mitigate their climate change losses and insurance companies’ adaptations to the selective vulnerabilities and losses brought about by climate change. I had to interrupt that series with a few blogs specific to academic institutions to help my students contribute to the discussions of these issues. With this blog and a few continuing blogs, I will return to the issue of global vulnerabilities.
Hey it’s so interesting post link
The solution is to plant 100 billion trees immediately and simultaneously throughout the world. take care of it and make sure it grows big.
Hi Professor Tomkiewicz,
CRI values are a unique way of indexing a list of countries most affected by the climate crisis. The value can serve as an invaluable, standardized tool for assessing the impact of climate change. One area where I could see such a measure being valuable is in the direction of Loss and Damage funds. These funds can serve for R&D in climate sectors concerning the preservation of current infrastructure. I say this because such funds could have greater potential in developing economies than in first-world ones; developing economies have a great incentive to research green energy solutions and solutions to mitigate the effects of natural disasters. Japan is an interesting case. It’s no surprise that Japan receives some of the harshest weather in the world; it has some of the highest snowfalls, very hot summers, and many earthquakes. Japan’s unique geography lands them on this list. But, I think this is good. Japan’s presence on this list shows that supranational organizations (UN notably) will need to consult various indexes to make informed decisions on where resources need to be directed.
Hi Professor,
First, I want to agree with Kyi, Martina and VingGa. The image of people dying due to extreme heat and suffering because of extreme weather conditions is terrifying. As Kyi said, we have already seen some of the impacts of these things. As Martina said, we’ll be in our 40s in 2050. That’s not even half of our life. In class, we spoke about younger generations. I have a nephew that’s less than a year old. I aim to have children some day. I have no idea what the future will look like for them. It breaks my heart.
Secondly, I want to agree wholeheartedly with Niamh. The countries with the most money and influence have the largest carbon footprints. It is vital that we share what is happening to the people in these countries. Right now, we are in a position where we can ignore it. We can pretend that things are fine – we do that very well. We are able to live comfortably because we aren’t feeling immediate and drastic effects on climate change. What is happening in other corners of the world should motivate us to take action.
Too many of us are living in denial. I mean, we are still having conversations on whether or not climate change is real. How insane is that? There is no urgency. This is something that will impact all of us. The choices that we make right now matter.
Thanks for this blog post, and all of your blog posts. I appreciate any media that exists to inform the world about climate change. It’s such a scary thing.
Best,
Zoe
Hello professor,
I notice that, in both lists of countries vulnerable to climate change, the countries listed are less wealthy than the US or in the global south/east. This is interesting to me, because it makes it easy to say that climate change is a third-world problem.
The United States is one of the biggest climate change contributors, and the home of many climate change deniers, from politicians to laymen. I think one of the reasons we have these climate change deniers is because they can’t see climate change in their everyday lives (or don’t know how to point to it). Third-world countries being the most vulnerable doesn’t help change the deniers’ minds, because to them, it’s proof that climate change will never effect them.
In my opinion, bringing the stories of these vulnerable countries to light would really help lots of Americans see climate change in action. It’s easy to ignore climate change in the US because of all the infrastructure we have to fall back on, but by seeing the lack of infrastructure in, say, Chad, it could sway some minds.
Thanks,
Niamh Zanghi
Hi Professor,
I would like to concur with both Kyi and Martina. I feel like the part that caught my attention in this blog the most is the mention of dangerously hot days by 2050, increase in drought, high wildfire and inland flooding. As Martina has stated, by 2050, our generation is still very much only halfway through our life, needless to say for younger generations. If climate change being so immensely affective to everyone on this planet doesn’t generate people to start creating change, then I’m not sure what else would. Even though climate change is such a big issue that could cause us our future, it’s still not getting enough recognition and people to create change.
Thank you,
VingGa
This is an interesting analysis based on the countries affected by climate change used on rankings with consequences. The analysis of the map from last year shows that the most vulnerable countries are located in North Africa and the Middle East recently and from 2019 data of CRI is fascinating as the countries seem to be similar but changing. These rankings’ dynamic nature raises concern about the significant effects of climate change, especially with regard to how it affects patterns of temperature. The focus shifts to the negative effects of heat, emphasizing the growing risks that come with rising temperatures. The effects of climate change on vulnerable countries are becoming more apparent as time goes on, and there could be dire repercussions for both the local population and the ecosystem.
I agree with what Martina said about providing data demonstrating how the heat will be intolerable to humans soon if this continues. People have to start acting now before the world gets worse, where multiple floods are happening and wildfires spread and contaminate the air. As shown by the Canadian wildfire we must protect our land so that it doesn’t happen again. The sky became a shade of orange and the air was not breathable.
About this reading I liked that the author mentions factors that will affect the lives of many in the future and demonstrate data that motivate us to improve the world before is too late. Something that concerned me a lot is the fact that by 2050 the heat will be almost intolerable for human kind to the point a lot of people will die due to extreme heat. However, what makes me more sad is the fact that I will only be around the age of 46 when this anomalies will affect the most. I believe that people will never try to knowledge and take initiative on how to save the world and the future generations from catastrophes of climate change.