Last week (March 15) we looked at three key findings:
- From the Pew Research survey of voters cast in OECD countries, the United States (ranked 4th from the bottom in the voters participation survey (2012 presidential elections) records about 55% of voters participation as percent of the voting age population and about 85% as percent of registered voters. The only country with compared discrepancy between registration and actual voting is Luxemburg. The obvious main culprit of low voter turnout seems to be low voter registration.
- Distribution of voter attendance by income (2008 elections) shows an average turnout of 59.7%, but participation by low income voters is considerably smaller than that by high income voters:
41.3% participation by those earning less than $10,000
Turnout doesn’t increase much until voter income reaches $20,000 rising from there monotonically in accordance with income (no outliers).
78.1% by those earning above $150,000
- The distribution of annual household income in the United States (2012) allows us to estimate how many voters do not participate in the US election and which economic class they represent.
The median household income in the US is around $51,000. There are around 134 million households in the country, with an average of 2.6 occupants each. In order to translate this information we need to evaluate the structure of US households. The total US population in 2012 was reported to be 314 million – a 10% discrepancy with the calculations from above.
Focusing on the 2012 data, here is the breakdown in terms of potential voters:
| Percentage of US population | Description | Potential voters |
| 19.6 | Married couples with children under 18 | 2 |
| 29.1 | Married couples without children | 2 |
| 17.8 | Other family households | 2 |
| 12.3 | Men living alone | 1 |
| 15.2 | Women living alone | 1 |
| 6.1 | Other non-family households | 1 |
For 100 households, the total number of potential voters comes out to be 167. Taking 10% of this number to be ineligible voters I arrive at 150 eligible voters per 100 households.
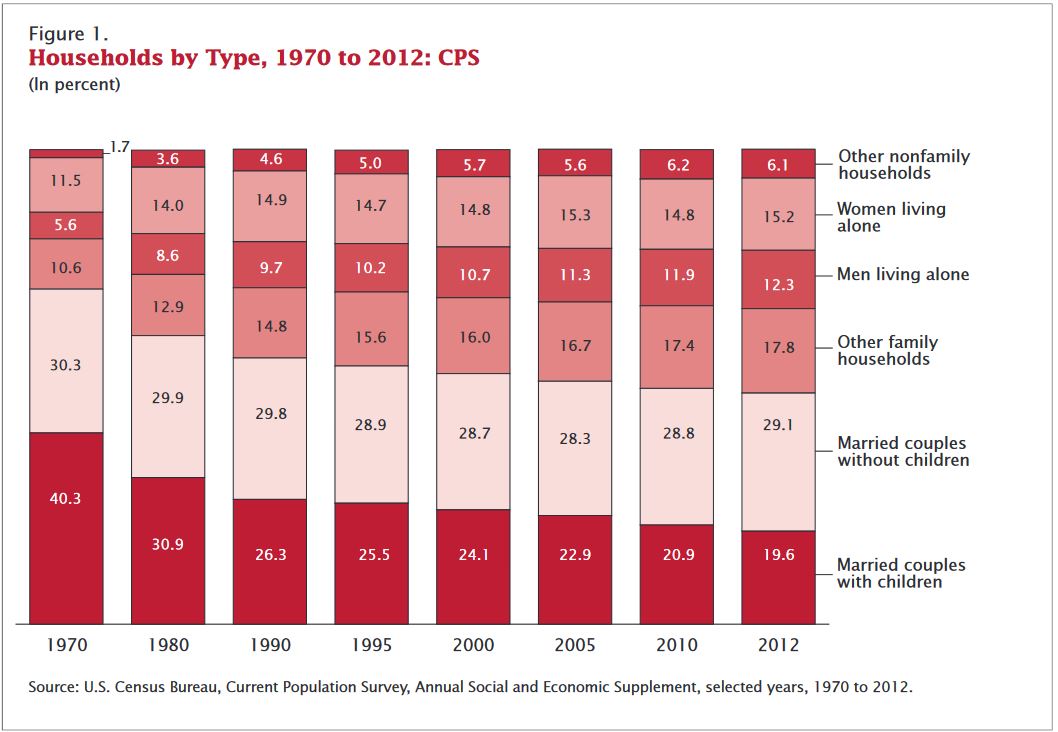
Figure 1 – Evolution of household structures from 1970 to 2012
Now we can go back to last week’s info to analyze the voter turnout by income, together with the distribution of household income to come out with the number of votes that we miss in two economic categories: household income above and below the country’s median income.
The number of eligible voters below the median income is calculated to be 54.5% (per definition a median should divide at exactly 50%; the difference came as a combination of both the histogram’s resolution of the dividing line and my own choice of where to put the line). If we use our count of 150 eligible voters per 100 households from earlier, we come out with 109 million eligible voters below the median household income. The average turnout for this group comes out to a mere 48%. This leaves 57 million eligible voters with income below the median that did not participate in the 2012 presidential election. The corresponding number of above median income non-participants was less than half of that: 25 million.
Let’s look at the second important issue raised by the Pew Research Survey shown in last week’s blog. If we go by percentage of possible voters who are registered or take part in elections, we are 4th from the bottom in the list of the OECD countries. If, on the other hand, we look in terms of participation as a percentage of registered voters, we are at a very respectable 85%. Clearly, our problem is our system of voter registration.
An easy target to blame for this is the growing list of legislation making registration more difficult for voters that the state authorities perceive to be unfriendly to the party in power. Southern states, largely controlled by Republican administrations, are infamous for these kinds of regulations. However, Figures 2 and 3 indicate that as despicable as these practices are, their effect seems minor and limited in its scope – at least within the given time period.
Figure 3 shows the distribution of voter turnout across the United States. The turnout in southern states like Texas and Oklahoma that are known for gaming the system with restrictive regulations is low but that is also the case for New York and California, neither of which has instituted such practices.
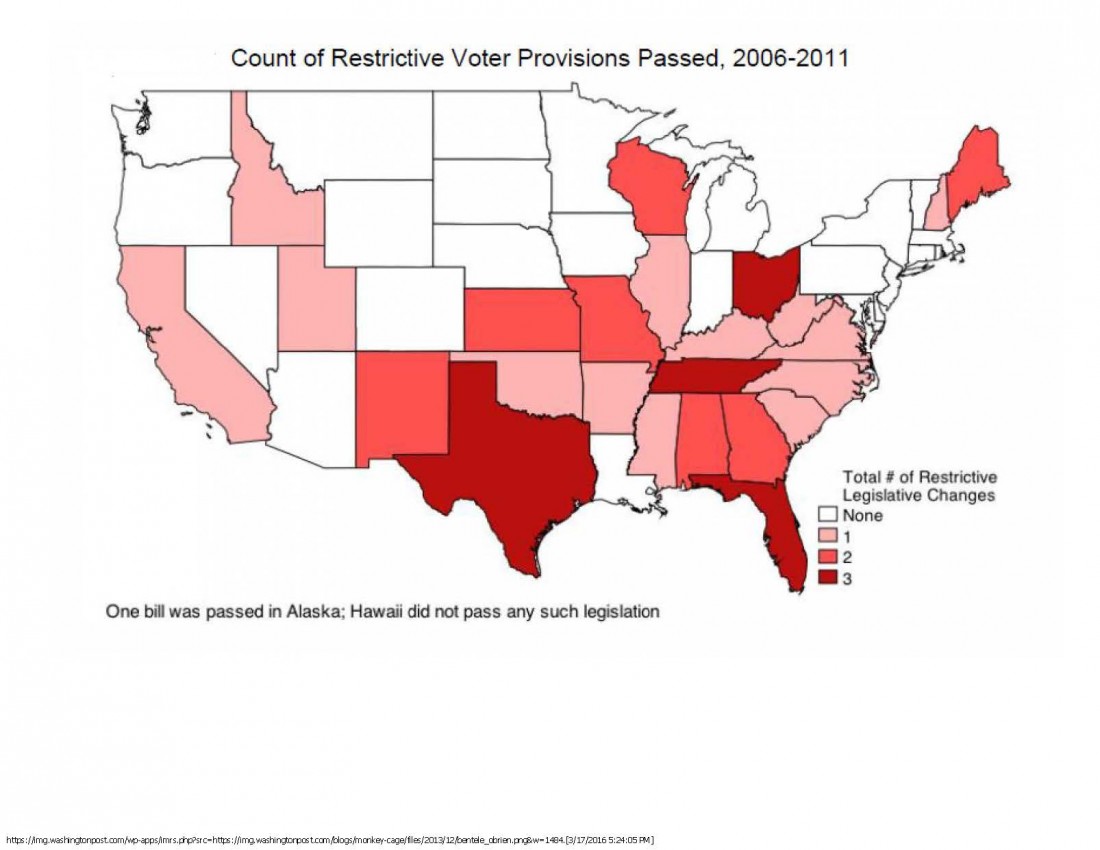 Figure 2 – Restrictive voter provisions
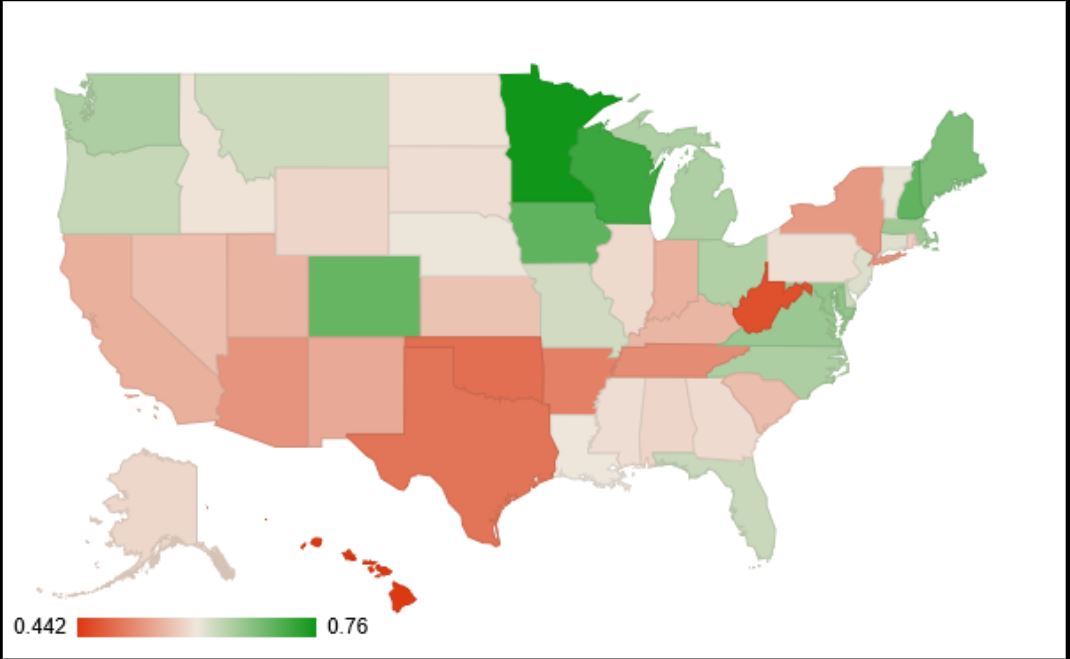
Figure 3 – Voter participation (2012) by state
One definition of democracy we have cited before is: an organization or situation in which everyone is treated equally and has equal rights.
Unfortunately, the Supreme Court, our highest authority on the Constitution has decided that money and speech are equivalent and both are constitutionally protected. Here is what I wrote:
In 2008, $5.3 billion were spent on the federal elections – $2.4 billion on the presidential elections alone. In 2012 super-PACs (Political Action Committees) were created to spend more than $350 million on political campaigns; 60% of that money came from a mere 100 donors. These committees were created as a product of two judicial decisions that essentially defended campaign contributions as free speech protected by the first amendment of the constitution. The Supreme Court approved the divisive Citizens United case in a 5:4 decision. As a result, super-PACs are forbidden from being directly connected with or giving money to a specific candidate. They can, however, spend unlimited money on advertising issues that play to a chosen candidate’s strengths. It turns out gaming the system is not a very demanding sport (even within a “full democracy”).
Close to half of the country – mostly that in the low income end of the financial spectrum – does not participate in choosing our government. The courts have amplified this inequality by allowing an unlimited use of money in campaign contributions. Two billionaire brothers announced that they were planning to spend close to a billion dollars on the 2016 election. We are quickly moving from the democracy we prize to the embodiment of oligarchy.
There are other factors not directly associated with economic status that affect our collective participation in the nature of government that we have. These include gender, race, age and education. I’ll look at those next week.